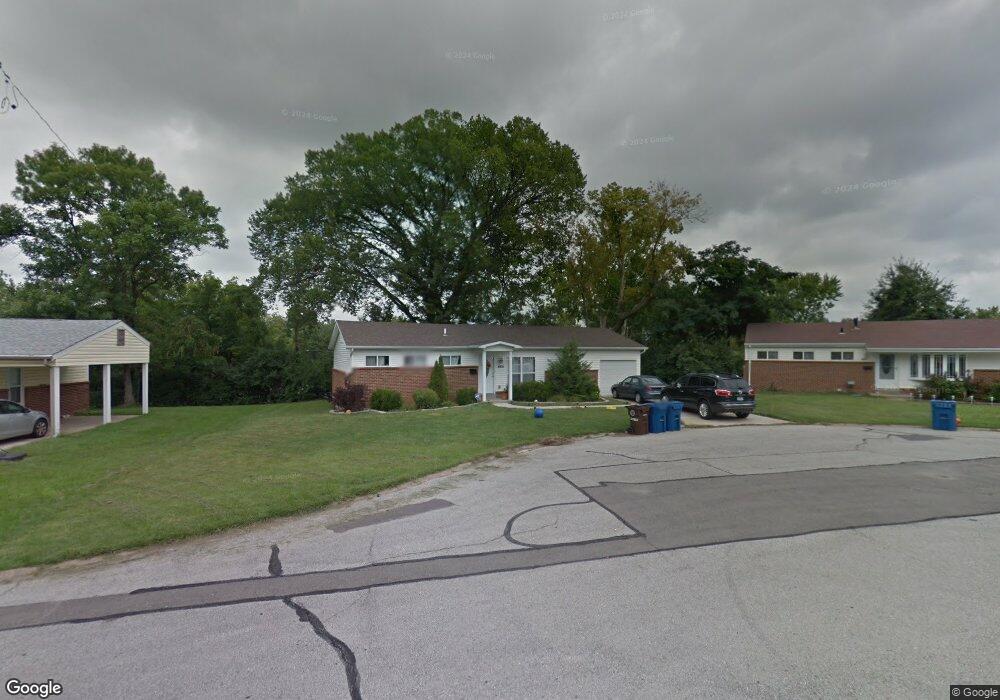
8805 Comstock Ct Saint Louis, MO 63132
Estimated Value: $283,122 - $356,000
3
Beds
2
Baths
1,350
Sq Ft
$234/Sq Ft
Est. Value
About This Home
This home is located at 8805 Comstock Ct, Saint Louis, MO 63132 and is currently estimated at $315,781, approximately $233 per square foot. 8805 Comstock Ct is a home located in St. Louis County with nearby schools including Reed Elementary, Ladue 5th Grade Center, and Ladue Middle School.
Ownership History
Date
Name
Owned For
Owner Type
Purchase Details
Closed on
Feb 17, 2010
Sold by
Spoto Salvatore and Spoto Myra
Bought by
Stephens Victor and Stephens Tobie Stelle
Current Estimated Value
Home Financials for this Owner
Home Financials are based on the most recent Mortgage that was taken out on this home.
Original Mortgage
$166,000
Interest Rate
5.11%
Mortgage Type
Seller Take Back
Purchase Details
Closed on
Oct 17, 2008
Sold by
Kleewein Christopher M and Kleewein Kimberly R
Bought by
Spoto Salvatore and Spoto Myra
Purchase Details
Closed on
Mar 11, 2008
Sold by
Glore Brian and Glore Laurie
Bought by
Kleewein Christopher M and Kleewein Kimberly R
Purchase Details
Closed on
Nov 28, 2007
Sold by
Kleewein Chris
Bought by
Glore Brian E and Glore Laurie L
Purchase Details
Closed on
Jun 9, 2006
Sold by
Thompson Donna J
Bought by
Kleewein Chris and Thompson Trust
Create a Home Valuation Report for This Property
The Home Valuation Report is an in-depth analysis detailing your home's value as well as a comparison with similar homes in the area
Home Values in the Area
Average Home Value in this Area
Purchase History
| Date | Buyer | Sale Price | Title Company |
|---|---|---|---|
| Stephens Victor | $181,000 | Multiple | |
| Spoto Salvatore | $40,000 | None Available | |
| Kleewein Christopher M | -- | None Available | |
| Glore Brian E | -- | None Available | |
| Kleewein Chris | $120,719 | None Available |
Source: Public Records
Mortgage History
| Date | Status | Borrower | Loan Amount |
|---|---|---|---|
| Closed | Stephens Victor | $166,000 |
Source: Public Records
Tax History
| Year | Tax Paid | Tax Assessment Tax Assessment Total Assessment is a certain percentage of the fair market value that is determined by local assessors to be the total taxable value of land and additions on the property. | Land | Improvement |
|---|---|---|---|---|
| 2025 | $3,055 | $47,940 | $34,370 | $13,570 |
| 2024 | $3,055 | $43,020 | $25,180 | $17,840 |
| 2023 | $3,089 | $43,020 | $25,180 | $17,840 |
| 2022 | $2,639 | $35,380 | $25,180 | $10,200 |
| 2021 | $2,624 | $35,380 | $25,180 | $10,200 |
| 2020 | $2,098 | $27,850 | $12,500 | $15,350 |
| 2019 | $2,032 | $27,850 | $12,500 | $15,350 |
| 2018 | $1,711 | $21,560 | $10,240 | $11,320 |
| 2017 | $1,705 | $21,560 | $10,240 | $11,320 |
| 2016 | $1,947 | $23,920 | $10,240 | $13,680 |
Source: Public Records
Map
Nearby Homes
- 1123 Hilltop Dr
- 8364 Fullerton Ave
- 1022 Dolores Ave
- 8637 Mayflower Ct
- 9311 Kenneth Place
- 8362 Braddock Dr
- 848 Aldan Dr
- 1432 Tamerton Ave
- 1193 Noa Ln Unit 30
- 9409 Olie Way Rd Unit 27
- 1181 Rd Unit 33
- 9401 Olie Way Rd Unit 30
- 1185 Noa Lane Rd Unit 32
- 1189 Noa Lane Rd Unit 31
- 9425 Olie Way Rd Unit 29
- 9547 Ridge Ave
- 8124 Braddock Dr
- 9518 Cote Brilliante Ave
- 1 Hill n Dale Ln
- 9112 Watsonia Ct
- 8811 Comstock Ct
- 8808 Chickasaw Ct
- 8801 Comstock Ct
- 8814 Chickasaw Ct
- 8804 Chickasaw Ct
- 8800 Comstock Ct
- 8808 Comstock Ct
- 8814 Comstock Ct
- 8804 Comstock Ct
- 1307 Arrowhead Dr
- 1301 Arrowhead Dr
- 8800 Chickasaw Ct
- 8900 Chickasaw Dr
- 8815 Chickasaw Ct
- 1313 Arrowhead Dr
- 8901 Comstock Dr
- 1233 Arrowhead Dr
- 8805 Chickasaw Ct
- 8809 Comanche Ct
- 8805 Comanche Ct
Your Personal Tour Guide
Ask me questions while you tour the home.