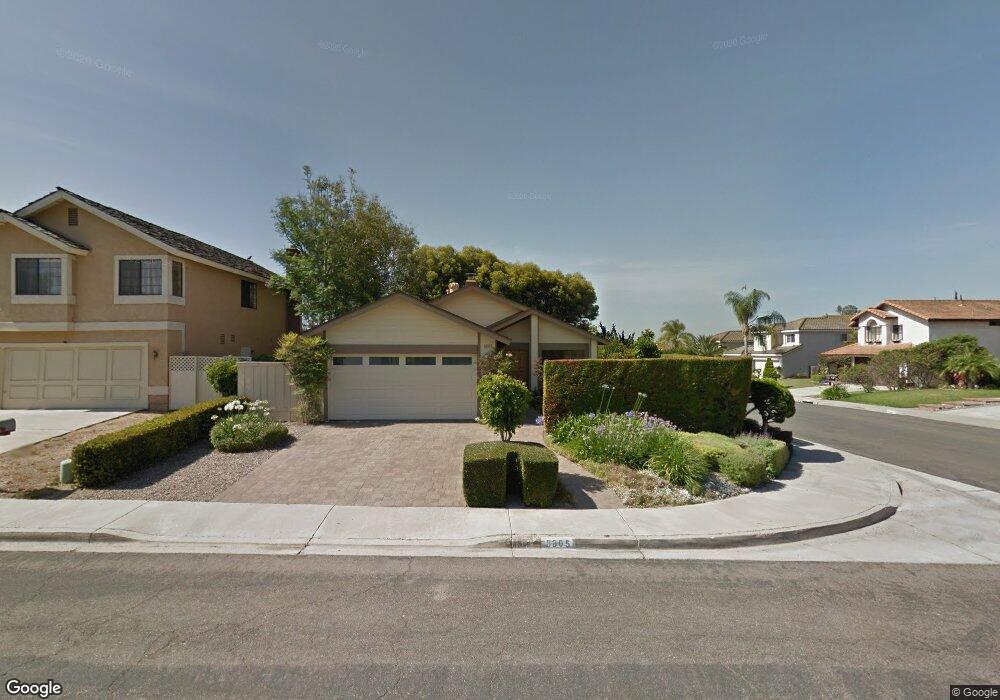
8805 La Cintura Ct San Diego, CA 92129
Rancho Peñasquitos NeighborhoodEstimated Value: $1,131,000 - $1,314,000
3
Beds
2
Baths
1,356
Sq Ft
$903/Sq Ft
Est. Value
About This Home
This home is located at 8805 La Cintura Ct, San Diego, CA 92129 and is currently estimated at $1,225,107, approximately $903 per square foot. 8805 La Cintura Ct is a home located in San Diego County with nearby schools including Adobe Bluffs Elementary School, Black Mountain Middle School, and Mt. Carmel High School.
Ownership History
Date
Name
Owned For
Owner Type
Purchase Details
Closed on
Dec 5, 2020
Sold by
Garcia Gary L and Garcia Mariela B
Bought by
Garcia Gary L and Garcia Mariela B
Current Estimated Value
Home Financials for this Owner
Home Financials are based on the most recent Mortgage that was taken out on this home.
Original Mortgage
$143,986
Outstanding Balance
$117,383
Interest Rate
3.1%
Mortgage Type
New Conventional
Estimated Equity
$1,107,724
Purchase Details
Closed on
Jun 23, 2015
Sold by
Garcia Gary L and Garcia Mariela B
Bought by
The Gary & Miriela Garcia Revocable Trus
Home Financials for this Owner
Home Financials are based on the most recent Mortgage that was taken out on this home.
Original Mortgage
$179,000
Interest Rate
3.81%
Mortgage Type
New Conventional
Purchase Details
Closed on
Dec 10, 2014
Sold by
Garcia Gary L and Garcia Mariela B
Bought by
Garcia Gary L and Garcia Mariela B
Purchase Details
Closed on
Aug 22, 1989
Bought by
Garcia Gary L Mariela B
Purchase Details
Closed on
May 13, 1985
Create a Home Valuation Report for This Property
The Home Valuation Report is an in-depth analysis detailing your home's value as well as a comparison with similar homes in the area
Home Values in the Area
Average Home Value in this Area
Purchase History
| Date | Buyer | Sale Price | Title Company |
|---|---|---|---|
| Garcia Gary L | -- | Amrock Llc | |
| Garcia Gary L | -- | Amrock Llc | |
| The Gary & Miriela Garcia Revocable Trus | -- | Accommodation | |
| Garcia Gary L | -- | First American Title Company | |
| Garcia Gary L | -- | None Available | |
| Garcia Gary L | -- | None Available | |
| Garcia Gary L Mariela B | $189,500 | -- | |
| -- | $130,000 | -- |
Source: Public Records
Mortgage History
| Date | Status | Borrower | Loan Amount |
|---|---|---|---|
| Open | Garcia Gary L | $143,986 | |
| Closed | Garcia Gary L | $179,000 |
Source: Public Records
Tax History Compared to Growth
Tax History
| Year | Tax Paid | Tax Assessment Tax Assessment Total Assessment is a certain percentage of the fair market value that is determined by local assessors to be the total taxable value of land and additions on the property. | Land | Improvement |
|---|---|---|---|---|
| 2025 | $3,926 | $367,700 | $133,687 | $234,013 |
| 2024 | $3,926 | $360,491 | $131,066 | $229,425 |
| 2023 | $3,836 | $353,424 | $128,497 | $224,927 |
| 2022 | $3,756 | $346,495 | $125,978 | $220,517 |
| 2021 | $3,702 | $339,702 | $123,508 | $216,194 |
| 2020 | $3,658 | $336,220 | $122,242 | $213,978 |
| 2019 | $3,584 | $329,629 | $119,846 | $209,783 |
| 2018 | $3,506 | $323,167 | $117,497 | $205,670 |
| 2017 | $83 | $316,832 | $115,194 | $201,638 |
| 2016 | $3,330 | $310,621 | $112,936 | $197,685 |
| 2015 | $3,280 | $305,956 | $111,240 | $194,716 |
| 2014 | -- | $299,963 | $109,061 | $190,902 |
Source: Public Records
Map
Nearby Homes
- 8862 La Cartera St
- 14305 El Vestido St
- 9120 Meadowrun Place
- 14442 Calle Nublado
- 13907 Bruyere Ct
- 9151 Emden Rd
- 8183 Doug Hill
- 8730 Twin Trails Dr
- 9360 Stargaze Ave
- 8114 Sendero de La Pradera
- 7808 Santaluz Inlet
- 8415 Run of the Knolls
- 7855 Via Belfiore Unit 1
- 13146 Thunderhead St
- 13445 Appalachian Way
- 7975 Villas
- 13640 Via Cima Bella
- 12740 Prairie Dog Ave
- 13338 Via Magdalena Unit 1
- 12880 War Horse St
- 8817 La Cintura Ct
- 8829 La Cintura Ct
- 8806 Adobe Bluffs Dr
- 14224 La Trucha St
- 14212 La Trucha St
- 8816 Adobe Bluffs Dr
- 14236 La Trucha St
- 14208 La Trucha St
- 8841 La Cintura Ct
- 8808 La Cintura Ct
- 8826 Adobe Bluffs Dr
- 8820 La Cintura Ct
- 14248 La Trucha St
- 8832 La Cintura Ct
- 14204 La Trucha St
- 14260 La Trucha St
- 8836 Adobe Bluffs Dr
- 11331 Jacob Ln
- 14227 Via Michelangelo
- 8844 La Cintura Ct