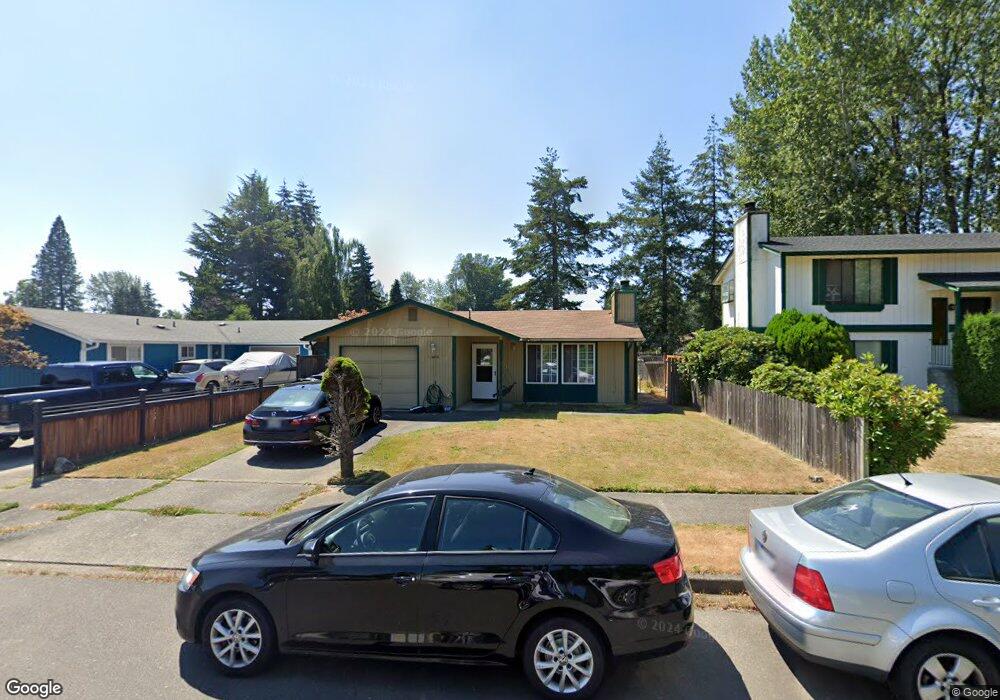
8806 E E St Tacoma, WA 98445
South End NeighborhoodEstimated Value: $396,000 - $424,000
3
Beds
1
Bath
890
Sq Ft
$459/Sq Ft
Est. Value
About This Home
This home is located at 8806 E E St, Tacoma, WA 98445 and is currently estimated at $408,667, approximately $459 per square foot. 8806 E E St is a home located in Pierce County with nearby schools including Larchmont Elementary School, Baker Middle School, and Mount Tahoma High School.
Ownership History
Date
Name
Owned For
Owner Type
Purchase Details
Closed on
Jan 24, 1997
Sold by
Johnson Wesley L and Johnson Ann K
Bought by
Atienza Teodoro A and Atienza Helen
Current Estimated Value
Home Financials for this Owner
Home Financials are based on the most recent Mortgage that was taken out on this home.
Original Mortgage
$77,500
Outstanding Balance
$8,904
Interest Rate
7.74%
Estimated Equity
$399,763
Create a Home Valuation Report for This Property
The Home Valuation Report is an in-depth analysis detailing your home's value as well as a comparison with similar homes in the area
Home Values in the Area
Average Home Value in this Area
Purchase History
| Date | Buyer | Sale Price | Title Company |
|---|---|---|---|
| Atienza Teodoro A | $93,071 | Commonwealth Land Title Ins |
Source: Public Records
Mortgage History
| Date | Status | Borrower | Loan Amount |
|---|---|---|---|
| Open | Atienza Teodoro A | $77,500 |
Source: Public Records
Tax History
| Year | Tax Paid | Tax Assessment Tax Assessment Total Assessment is a certain percentage of the fair market value that is determined by local assessors to be the total taxable value of land and additions on the property. | Land | Improvement |
|---|---|---|---|---|
| 2025 | $3,615 | $345,900 | $172,300 | $173,600 |
| 2024 | $3,615 | $348,900 | $174,100 | $174,800 |
| 2023 | $3,615 | $324,400 | $167,000 | $157,400 |
| 2022 | $3,193 | $330,000 | $158,100 | $171,900 |
| 2021 | $2,924 | $232,300 | $103,700 | $128,600 |
| 2019 | $2,456 | $211,300 | $88,700 | $122,600 |
| 2018 | $2,493 | $188,700 | $72,000 | $116,700 |
| 2017 | $2,188 | $157,600 | $54,200 | $103,400 |
| 2016 | $1,957 | $119,900 | $41,000 | $78,900 |
| 2014 | $1,593 | $112,400 | $39,800 | $72,600 |
| 2013 | $1,593 | $96,900 | $33,700 | $63,200 |
Source: Public Records
Map
Nearby Homes
- 915 90th St E
- 503 E 91st St
- 8440 E D St
- 9th A Avenue Ct E
- 9404 Mckinley Ave E
- 8212 8th Avenue Ct E Unit 1
- 8519 Golden Given Rd E
- 8515 Golden Given Rd E
- 105 E 96th St
- 8821 S D St
- 9638 D St E
- 7918 Mckinley Ave
- 521 E 78th St
- 301 S 82nd St
- 8430 Fawcett Ave
- 511 S 92nd St
- 319 S 82nd St
- 8843 S G St
- 9618 Pacific Ave
- 7552 E F St
Your Personal Tour Guide
Ask me questions while you tour the home.