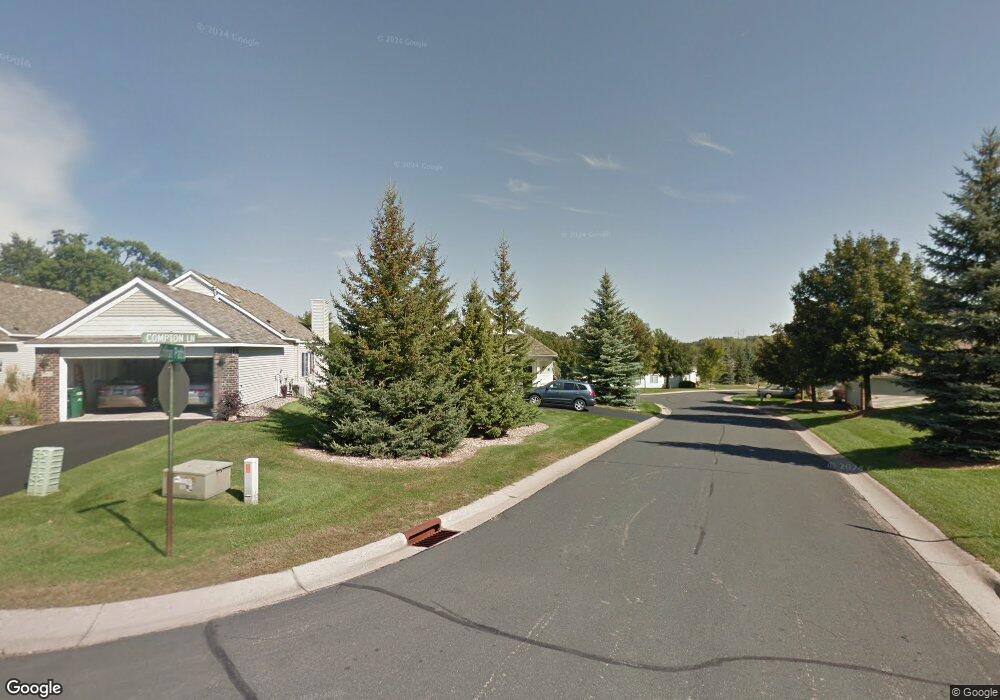
8807 Compton Ln Inver Grove Heights, MN 55076
Estimated Value: $327,000 - $376,000
2
Beds
2
Baths
1,484
Sq Ft
$237/Sq Ft
Est. Value
About This Home
This home is located at 8807 Compton Ln, Inver Grove Heights, MN 55076 and is currently estimated at $351,709, approximately $237 per square foot. 8807 Compton Ln is a home located in Dakota County with nearby schools including Pine Bend Elementary School, Inver Grove Heights Middle School, and Simley Senior High School.
Ownership History
Date
Name
Owned For
Owner Type
Purchase Details
Closed on
Aug 31, 2015
Sold by
Hein Ronald V and Hein Bonita K
Bought by
Olson Donald H and Olson Mary L
Current Estimated Value
Purchase Details
Closed on
Jun 30, 2006
Sold by
Gaska Elizabeth L
Bought by
Hein Ronald and Hein Bonita K
Purchase Details
Closed on
May 15, 1999
Sold by
Strantz Patrick L and Strantz Lori L
Bought by
Gaska Elizabeth
Purchase Details
Closed on
Aug 12, 1997
Sold by
The Rottlund Company
Bought by
Strantz Patrick L and Jirschele Lori L
Create a Home Valuation Report for This Property
The Home Valuation Report is an in-depth analysis detailing your home's value as well as a comparison with similar homes in the area
Home Values in the Area
Average Home Value in this Area
Purchase History
| Date | Buyer | Sale Price | Title Company |
|---|---|---|---|
| Olson Donald H | $245,000 | Burnet Title | |
| Hein Ronald | $259,000 | -- | |
| Gaska Elizabeth | $190,000 | -- | |
| Strantz Patrick L | $149,468 | -- |
Source: Public Records
Tax History Compared to Growth
Tax History
| Year | Tax Paid | Tax Assessment Tax Assessment Total Assessment is a certain percentage of the fair market value that is determined by local assessors to be the total taxable value of land and additions on the property. | Land | Improvement |
|---|---|---|---|---|
| 2024 | $2,874 | $287,700 | $64,300 | $223,400 |
| 2023 | $2,874 | $288,200 | $64,700 | $223,500 |
| 2022 | $2,694 | $291,400 | $64,600 | $226,800 |
| 2021 | $2,788 | $254,400 | $56,200 | $198,200 |
| 2020 | $2,598 | $258,000 | $53,500 | $204,500 |
| 2019 | $2,441 | $241,800 | $51,000 | $190,800 |
| 2018 | $2,210 | $215,100 | $47,200 | $167,900 |
| 2017 | $2,255 | $195,900 | $43,700 | $152,200 |
| 2016 | $2,203 | $195,300 | $41,600 | $153,700 |
| 2015 | $2,139 | $170,078 | $35,411 | $134,667 |
| 2014 | -- | $154,491 | $31,970 | $122,521 |
| 2013 | -- | $140,866 | $28,966 | $111,900 |
Source: Public Records
Map
Nearby Homes
- 8827 Coffman Path
- 8770 Benson Way Unit 82
- TBd Cahill Blvd Blvd
- 3853 90th St E
- 8590 Corcoran Path
- 8550 Corcoran Path
- 8355 Cooper Way
- 8816 Brunell Way Unit 404
- 8904 Brunswick Path Unit 2104
- 8361 Carew Ct
- 8336 Cloman Ave
- 8124 Clifford Cir
- 8381 Corcoran Cir Unit 49
- 8789 Branson Dr Unit 72
- 9649-9665 Cedarwood Ct
- 3750 80th St E
- 8104 Dana Path
- 8086 Dana Path
- 3295 80th St E Unit 508
- 7949 Cooper Ave E
- 8852 Coffman Path
- 8908 Coffman Path
- 8811 Compton Dr
- 8850 Compton Ln
- 8832 Coffman Path
- 8854 Compton Ln
- 8812 Compton Dr
- 8916 Coffman Path
- 8813 Compton Dr
- 8813 Compton Dr
- 8895 Coffman Path
- 8858 Compton Ln
- 8926 Coffman Path
- 8819 Compton Dr
- 8820 Compton Dr
- 8911 Coffman Path
- 8845 Coffman Path
- 8860 Compton Ln
- 8919 Coffman Path
- 8831 Coffman Path