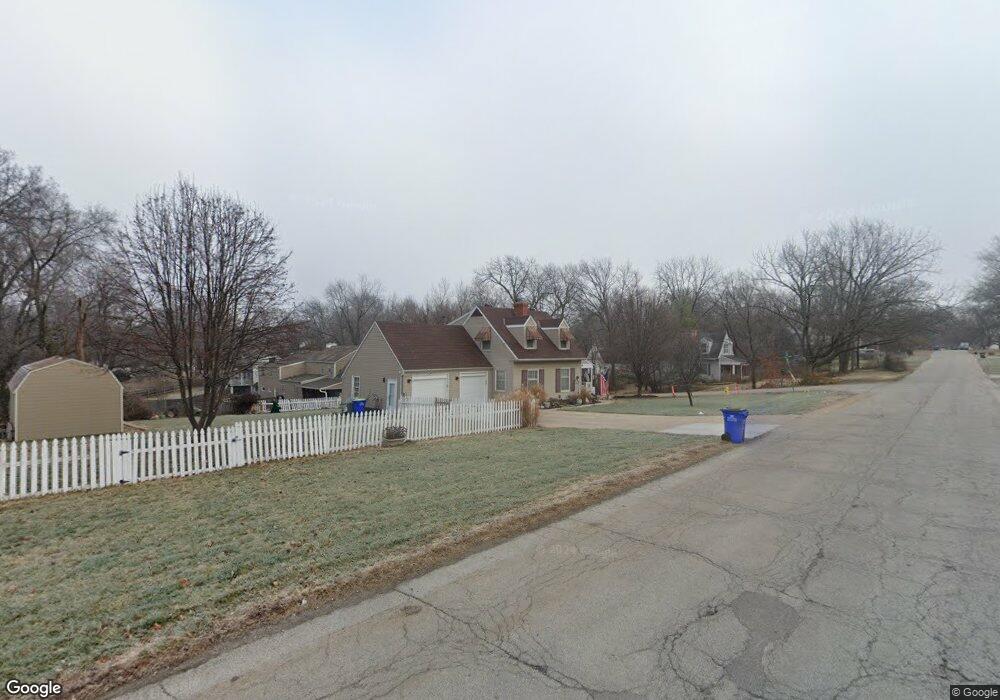
8808 E 66th St Raytown, MO 64133
Estimated Value: $175,970 - $188,000
2
Beds
2
Baths
998
Sq Ft
$183/Sq Ft
Est. Value
About This Home
This home is located at 8808 E 66th St, Raytown, MO 64133 and is currently estimated at $182,493, approximately $182 per square foot. 8808 E 66th St is a home located in Jackson County with nearby schools including Blue Ridge Elementary School, Raytown Central Middle School, and Carver Christian Academy.
Ownership History
Date
Name
Owned For
Owner Type
Purchase Details
Closed on
May 9, 2022
Sold by
Creamer Joseph D and Creamer Patricia
Bought by
Meridel Development Llc
Current Estimated Value
Purchase Details
Closed on
Feb 3, 2020
Sold by
Creamer Joseph Daniel and Creamer Joseph
Bought by
Creamer Joseph and Creamer Patricia
Home Financials for this Owner
Home Financials are based on the most recent Mortgage that was taken out on this home.
Original Mortgage
$87,000
Interest Rate
3.74%
Mortgage Type
New Conventional
Purchase Details
Closed on
Dec 11, 2014
Sold by
Creamer Darla Renae
Bought by
Creamer Joseph Daniel
Purchase Details
Closed on
May 1, 2000
Sold by
Paul Andrews Eric and Paul Mary E
Bought by
Creamer Joseph D and Creamer Darla D
Home Financials for this Owner
Home Financials are based on the most recent Mortgage that was taken out on this home.
Original Mortgage
$77,425
Interest Rate
8.23%
Mortgage Type
Purchase Money Mortgage
Create a Home Valuation Report for This Property
The Home Valuation Report is an in-depth analysis detailing your home's value as well as a comparison with similar homes in the area
Home Values in the Area
Average Home Value in this Area
Purchase History
| Date | Buyer | Sale Price | Title Company |
|---|---|---|---|
| Meridel Development Llc | -- | Continental Title | |
| Creamer Joseph | -- | None Available | |
| Creamer Joseph Daniel | -- | None Available | |
| Creamer Joseph D | -- | First American Title Ins |
Source: Public Records
Mortgage History
| Date | Status | Borrower | Loan Amount |
|---|---|---|---|
| Previous Owner | Creamer Joseph | $87,000 | |
| Previous Owner | Creamer Joseph D | $77,425 |
Source: Public Records
Tax History
| Year | Tax Paid | Tax Assessment Tax Assessment Total Assessment is a certain percentage of the fair market value that is determined by local assessors to be the total taxable value of land and additions on the property. | Land | Improvement |
|---|---|---|---|---|
| 2025 | $2,211 | $21,859 | $6,091 | $15,768 |
| 2024 | $2,196 | $24,510 | $5,130 | $19,380 |
| 2023 | $2,196 | $24,510 | $5,130 | $19,380 |
| 2022 | $1,555 | $16,530 | $4,674 | $11,856 |
| 2021 | $1,560 | $16,530 | $4,674 | $11,856 |
| 2020 | $1,579 | $16,563 | $4,674 | $11,889 |
| 2019 | $1,570 | $16,563 | $4,674 | $11,889 |
| 2018 | $1,420 | $15,520 | $3,934 | $11,586 |
| 2017 | $1,420 | $15,520 | $3,934 | $11,586 |
| 2016 | $1,377 | $15,132 | $2,936 | $12,196 |
Source: Public Records
Map
Nearby Homes
- 8920 Rose Ln
- 6301 Kentucky Ave
- 8705 E 63rd St
- 9202 E 64th Terrace
- 6824 Laurel Ave
- 6924 Hunter St
- 6121 Hunter St
- 8500 E State Route 350
- 9314 E 68th Terrace
- 9416 E 64th St
- 9616 E 66th St
- 8510 E 71st Terrace
- 9609 E 68th St
- 5936 Laurel Ave
- 8315 E Gregory Blvd
- 6905 Sycamore Ave
- 8852 E 59th Terrace
- 8804 E 59th Terrace
- 7300 Elm Ave
- 6708 Manchester Ave
- 8804 E 66th St
- 8904 Rose Ln
- 8809 E 66th St
- 8805 E 66th St
- 8903 Rose Ln
- 8912 Rose Ln
- 8902 E 66th St
- 8800 E 66th St
- 6523 Blue Ridge Blvd
- 8903 E 66th St
- 6519 Blue Ridge Blvd
- 8915 Rose Ln
- 6519 Blue Ridge Blvd
- 6513 Blue Ridge Blvd
- 6515 Blue Ridge Blvd
- 8904 E 66th St
- 8914 Rose Ln
- 6511 Blue Ridge Blvd
- 8905 E 66th St
- 8906 E 66th St
Your Personal Tour Guide
Ask me questions while you tour the home.