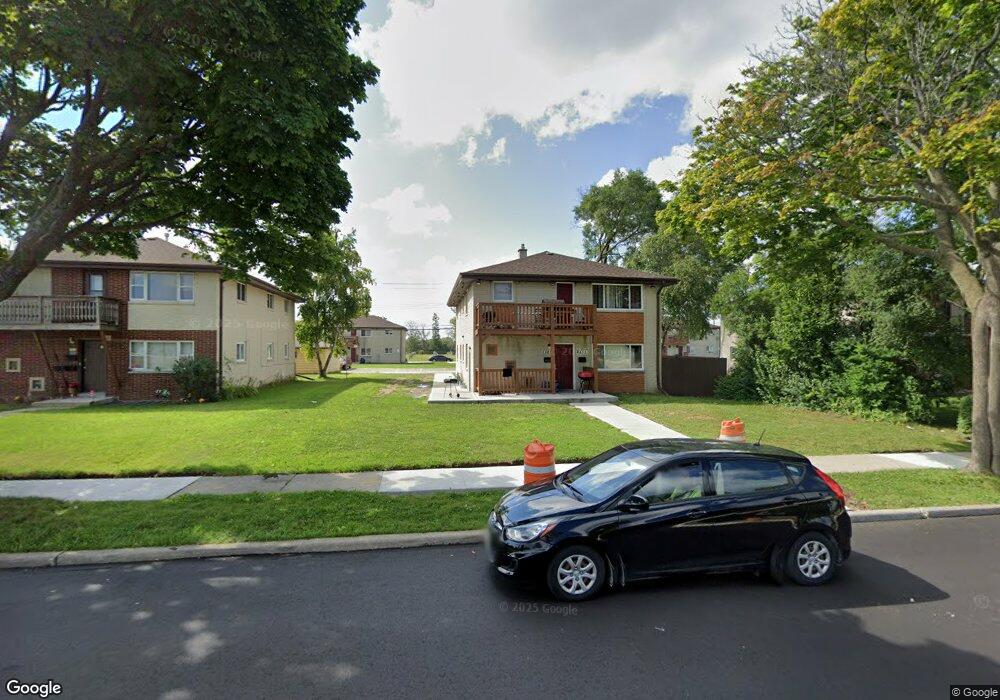
8809 W Thurston Ave Unit 8811 Milwaukee, WI 53225
Silver Swan NeighborhoodEstimated Value: $205,000 - $258,611
6
Beds
4
Baths
2,352
Sq Ft
$100/Sq Ft
Est. Value
About This Home
This home is located at 8809 W Thurston Ave Unit 8811, Milwaukee, WI 53225 and is currently estimated at $234,653, approximately $99 per square foot. 8809 W Thurston Ave Unit 8811 is a home located in Milwaukee County with nearby schools including Bryant School, Craig Montessori School, and Milwaukee German Immersion School.
Ownership History
Date
Name
Owned For
Owner Type
Purchase Details
Closed on
Feb 12, 2020
Sold by
Dak Properties Xiv Llc
Bought by
Berrada Properties 50 Llc
Current Estimated Value
Purchase Details
Closed on
May 11, 2011
Sold by
Erlandson David L
Bought by
Dak Properties Xiii Llc
Purchase Details
Closed on
May 4, 2011
Sold by
Erlandson David L and Erlandson Kathryn Erlandson
Bought by
Erlandson David L
Purchase Details
Closed on
Aug 31, 1999
Sold by
Knapp Charles G and Knapp Ruth L
Bought by
Capital 43 Llc
Purchase Details
Closed on
Jan 1, 1998
Sold by
Knapp Charles G and Knapp Ruth L
Bought by
Eastmore Trust
Home Financials for this Owner
Home Financials are based on the most recent Mortgage that was taken out on this home.
Original Mortgage
$55,129
Interest Rate
8%
Mortgage Type
Purchase Money Mortgage
Create a Home Valuation Report for This Property
The Home Valuation Report is an in-depth analysis detailing your home's value as well as a comparison with similar homes in the area
Home Values in the Area
Average Home Value in this Area
Purchase History
| Date | Buyer | Sale Price | Title Company |
|---|---|---|---|
| Berrada Properties 50 Llc | $4,938,500 | Dominion Title & Exchanve | |
| Dak Properties Xiii Llc | -- | None Available | |
| Erlandson David L | -- | None Available | |
| Capital 43 Llc | -- | -- | |
| Eastmore Trust | $66,000 | -- |
Source: Public Records
Mortgage History
| Date | Status | Borrower | Loan Amount |
|---|---|---|---|
| Previous Owner | Eastmore Trust | $55,129 |
Source: Public Records
Tax History Compared to Growth
Tax History
| Year | Tax Paid | Tax Assessment Tax Assessment Total Assessment is a certain percentage of the fair market value that is determined by local assessors to be the total taxable value of land and additions on the property. | Land | Improvement |
|---|---|---|---|---|
| 2024 | $3,767 | $168,100 | $9,000 | $159,100 |
| 2023 | $3,807 | $161,100 | $11,400 | $149,700 |
| 2022 | $3,763 | $161,100 | $11,400 | $149,700 |
| 2021 | $3,238 | $125,900 | $11,700 | $114,200 |
| 2020 | $3,220 | $125,900 | $11,700 | $114,200 |
| 2019 | $2,721 | $100,900 | $9,300 | $91,600 |
| 2018 | $2,554 | $100,900 | $9,300 | $91,600 |
| 2017 | $2,479 | $93,500 | $10,300 | $83,200 |
| 2016 | $2,511 | $90,100 | $10,300 | $79,800 |
| 2015 | -- | $100,000 | $10,300 | $89,700 |
| 2014 | -- | $100,000 | $10,300 | $89,700 |
| 2013 | -- | $100,000 | $10,300 | $89,700 |
Source: Public Records
Map
Nearby Homes
- Lt0 N 91st St
- 8600 W Fond du Lac Ave
- 5817 N 91st St
- 8748 W Fond du Lac Ave
- 8811 W Lawn Ave
- 8922 W Villard Ave
- 8720 W Kaul Ave
- 5761 N 97th St
- 8542 W Villard Ave Unit 8A
- 5714 N 98th St
- 8730 W Kaul Ave
- 8426 W Villard Ave
- 8164 W Muriel Place
- 5777 N 98th St
- 8638 W Lynx Ave
- 8800 W Douglas Ave
- 5723 N 77th St
- 5065 N 84th St
- 5803 N 77th St
- 5753 N 76th St
- 8801 W Thurston Ave Unit 8803
- 8817 W Thurston Ave Unit 8819
- 8803 W Thurston Ave
- 8729 W Thurston Ave Unit 8731
- 8825 W Thurston Ave
- 8800 W Silver Spring Dr
- 8810 W Silver Spring Dr
- 8721 W Thurston Ave Unit 8723
- 8835 W Thurston Ave
- 8726 W Silver Spring Dr
- 8822 W Silver Spring Dr
- 8711 W Thurston Ave Unit 8713
- 8832 W Silver Spring Dr
- 8714 W Silver Spring Dr
- 8700 W Silver Spring Dr
- 8902 W Silver Spring Dr
- 5647 N 89th St
- 5655 N 89th St
- 5663 N 89th St
- 8914 W Silver Spring Dr