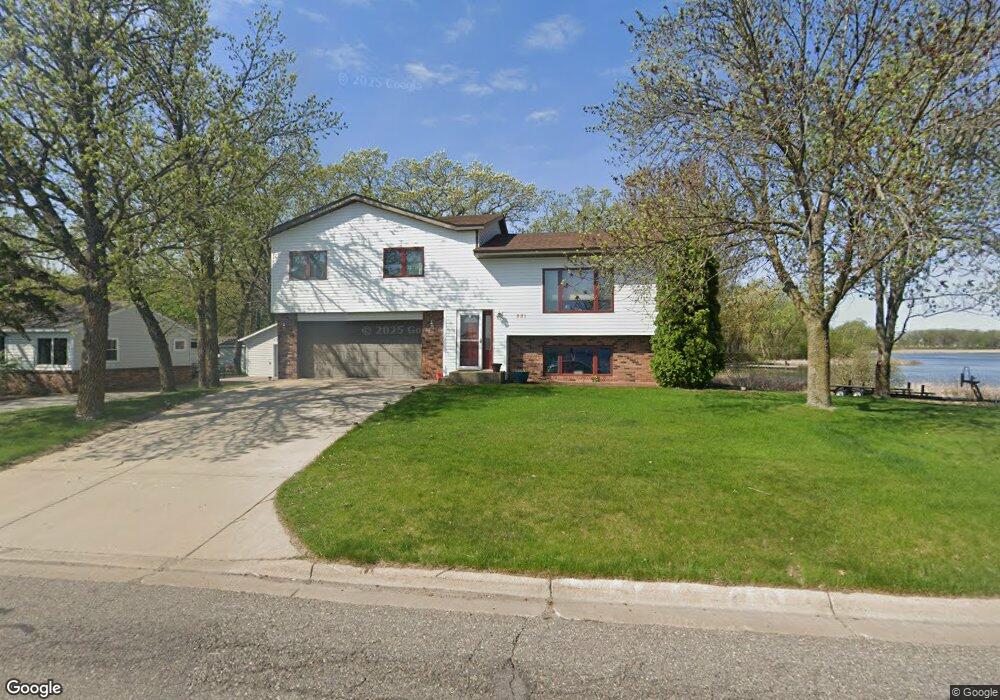
881 Lakeshore Dr Big Lake, MN 55309
Estimated Value: $293,245 - $384,000
3
Beds
3
Baths
1,830
Sq Ft
$193/Sq Ft
Est. Value
About This Home
This home is located at 881 Lakeshore Dr, Big Lake, MN 55309 and is currently estimated at $353,061, approximately $192 per square foot. 881 Lakeshore Dr is a home located in Sherburne County with nearby schools including Liberty Elementary School, Independence Elementary School, and Big Lake Middle School.
Ownership History
Date
Name
Owned For
Owner Type
Purchase Details
Closed on
Jul 17, 2019
Sold by
Dang Thanh K and Dang Hong-Yen
Bought by
Hagebeck Richard Ludwig
Current Estimated Value
Home Financials for this Owner
Home Financials are based on the most recent Mortgage that was taken out on this home.
Original Mortgage
$180,000
Outstanding Balance
$157,631
Interest Rate
3.8%
Mortgage Type
New Conventional
Estimated Equity
$195,430
Purchase Details
Closed on
Dec 16, 2008
Sold by
Meinerz Lee and Otto Ann
Bought by
Dang Thanh K and Dang Hong Yeng
Purchase Details
Closed on
Jul 29, 2005
Sold by
Dorsey Patrick D and Dorsey Juliana Mullins
Bought by
Meinerz Lee and Otto Ann
Purchase Details
Closed on
Jul 29, 2002
Sold by
Moshier Rita A
Bought by
Dorsey Patrick A and Dorsey Juliana Mullins
Purchase Details
Closed on
Oct 28, 1996
Sold by
Felder Pearl G
Bought by
Moshier Bernard P and Moshier Risa A
Create a Home Valuation Report for This Property
The Home Valuation Report is an in-depth analysis detailing your home's value as well as a comparison with similar homes in the area
Home Values in the Area
Average Home Value in this Area
Purchase History
| Date | Buyer | Sale Price | Title Company |
|---|---|---|---|
| Hagebeck Richard Ludwig | $280,000 | Titlesmart Inc | |
| Dang Thanh K | $270,118 | -- | |
| Meinerz Lee | $289,400 | -- | |
| Dorsey Patrick A | $253,500 | -- | |
| Moshier Bernard P | $128,500 | -- |
Source: Public Records
Mortgage History
| Date | Status | Borrower | Loan Amount |
|---|---|---|---|
| Open | Hagebeck Richard Ludwig | $180,000 |
Source: Public Records
Tax History Compared to Growth
Tax History
| Year | Tax Paid | Tax Assessment Tax Assessment Total Assessment is a certain percentage of the fair market value that is determined by local assessors to be the total taxable value of land and additions on the property. | Land | Improvement |
|---|---|---|---|---|
| 2025 | $5,036 | $100 | $100 | $0 |
| 2024 | $5,240 | $100 | $100 | $0 |
| 2023 | $4,898 | $100 | $100 | $0 |
| 2022 | $4,288 | $388,500 | $149,100 | $239,400 |
| 2020 | $4,202 | $287,000 | $96,700 | $190,300 |
| 2019 | $3,892 | $276,200 | $98,400 | $177,800 |
| 2018 | $3,774 | $244,500 | $81,400 | $163,100 |
| 2017 | $3,666 | $226,700 | $77,700 | $149,000 |
| 2016 | $3,572 | $214,300 | $74,200 | $140,100 |
| 2015 | $3,366 | $208,900 | $74,800 | $134,100 |
| 2014 | $3,232 | $197,300 | $66,600 | $130,700 |
| 2013 | -- | $184,600 | $65,900 | $118,700 |
Source: Public Records
Map
Nearby Homes
- 679 Lakeshore Dr
- 491 Highland Ave
- TBD Manitou St
- 241 Leighton Dr
- 3300 Lake View Ln
- 20311 Gordon Ln
- TBD Highway 10 NW
- 20050 County Road 81 NW
- 5008 Bluff Rd
- 4637 Pond View Cir
- 3250 Lake Ridge Dr
- 4265 Lake Ridge Dr
- 100 Park Ave
- 240 Wyoming Ave
- 20172 Truman Dr
- 1075 Kilbirnie Rd
- 20189 Esther Pkwy
- 110 Powell Cir E
- 5190 Edinburgh Way
- 637 Norwood Ln
- 861 Lakeshore Dr
- 851 Lakeshore Dr
- 851 Lakeshore Dr
- 710 Shady Ln
- 801 Lakeshore Dr
- 750 Shady Ln
- 800 Lakeshore Dr
- 721 Shady Ln
- 721 Shady Ln
- 721 Shady Ln
- 705 Shady Ln
- 770 Lakeshore Dr
- 711 Shady Ln
- 760 Shady Ln
- 731 Lakeshore Dr
- 750 Lakeshore Dr
- 921 Lakeshore Dr
- 761 Shady Ln
- 721 Lakeshore Dr
- 650 Red Oak Dr