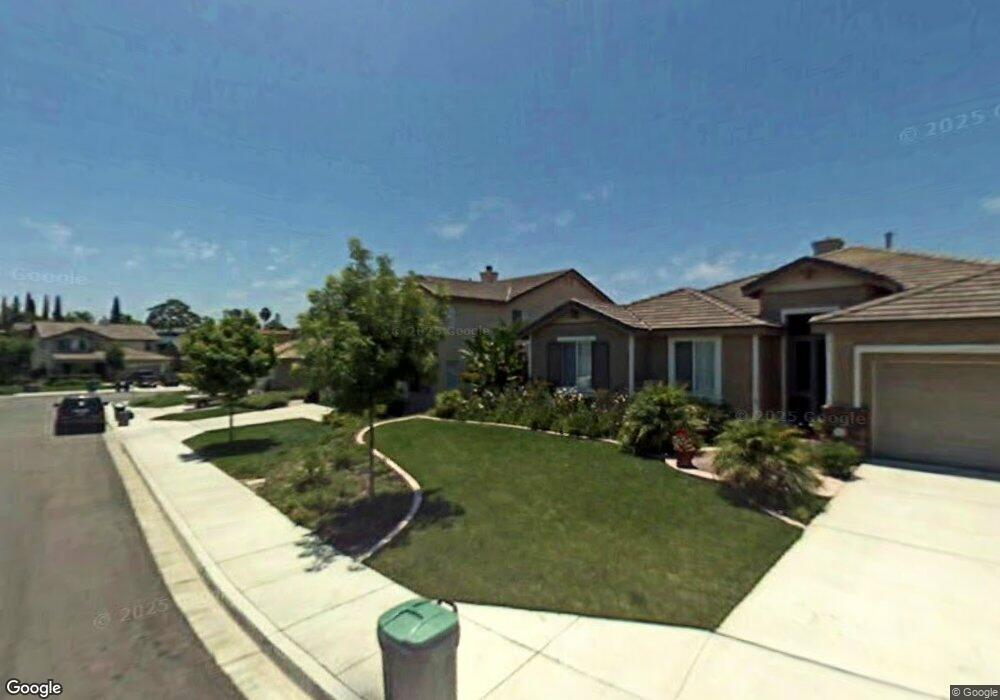
881 Panella Dr Unit II Oceanside, CA 92057
North Valley NeighborhoodEstimated Value: $1,006,000 - $1,195,000
4
Beds
3
Baths
2,660
Sq Ft
$403/Sq Ft
Est. Value
About This Home
This home is located at 881 Panella Dr Unit II, Oceanside, CA 92057 and is currently estimated at $1,071,087, approximately $402 per square foot. 881 Panella Dr Unit II is a home located in San Diego County with nearby schools including Reynolds Elementary School, Cesar Chavez Middle School, and Peppertree Montessori School.
Ownership History
Date
Name
Owned For
Owner Type
Purchase Details
Closed on
Aug 17, 2022
Sold by
John Venter Jr Robert and John Nichole Jean
Bought by
Thomas Rosalind
Current Estimated Value
Home Financials for this Owner
Home Financials are based on the most recent Mortgage that was taken out on this home.
Original Mortgage
$911,680
Outstanding Balance
$867,882
Interest Rate
4.99%
Mortgage Type
VA
Estimated Equity
$203,205
Purchase Details
Closed on
Sep 12, 2020
Sold by
Venter Robert John and Venter Jean Nichole
Bought by
Venter Robert John and Panella Court Trust
Purchase Details
Closed on
Jan 2, 2002
Sold by
Pinnacle Oceanside 104 Lp
Bought by
Venter Robert John and Venter Jean Nichole
Home Financials for this Owner
Home Financials are based on the most recent Mortgage that was taken out on this home.
Original Mortgage
$265,100
Interest Rate
7.04%
Mortgage Type
Balloon
Create a Home Valuation Report for This Property
The Home Valuation Report is an in-depth analysis detailing your home's value as well as a comparison with similar homes in the area
Home Values in the Area
Average Home Value in this Area
Purchase History
| Date | Buyer | Sale Price | Title Company |
|---|---|---|---|
| Thomas Rosalind | $880,000 | Western Resources | |
| Venter Robert John | -- | None Available | |
| Venter Robert John | $331,500 | Chicago Title Co |
Source: Public Records
Mortgage History
| Date | Status | Borrower | Loan Amount |
|---|---|---|---|
| Open | Thomas Rosalind | $911,680 | |
| Previous Owner | Venter Robert John | $265,100 | |
| Closed | Venter Robert John | $33,100 |
Source: Public Records
Tax History Compared to Growth
Tax History
| Year | Tax Paid | Tax Assessment Tax Assessment Total Assessment is a certain percentage of the fair market value that is determined by local assessors to be the total taxable value of land and additions on the property. | Land | Improvement |
|---|---|---|---|---|
| 2025 | $10,139 | $915,550 | $303,875 | $611,675 |
| 2024 | $10,139 | $897,599 | $297,917 | $599,682 |
| 2023 | $9,826 | $880,000 | $292,076 | $587,924 |
| 2022 | $5,141 | $461,337 | $153,120 | $308,217 |
| 2021 | $5,155 | $452,292 | $150,118 | $302,174 |
| 2020 | $4,996 | $447,655 | $148,579 | $299,076 |
| 2019 | $4,850 | $438,878 | $145,666 | $293,212 |
| 2018 | $4,797 | $430,273 | $142,810 | $287,463 |
| 2017 | $4,707 | $421,837 | $140,010 | $281,827 |
| 2016 | $4,554 | $413,566 | $137,265 | $276,301 |
| 2015 | $4,421 | $407,355 | $135,204 | $272,151 |
| 2014 | $4,250 | $399,376 | $132,556 | $266,820 |
Source: Public Records
Map
Nearby Homes
- 871 Niguel St
- 675 Parker St
- 671 Parker St
- 5014 El Mirlo Dr
- 5108 Eliot St
- 1247 Bellingham Dr
- 5116 Weymouth Way
- 4795 Stephanie Place
- 0 Indian View Dr
- 1061 Boulder Place
- 1120 Parkview Dr
- 1447 Puritan Dr
- 530 Roja Dr
- 1049 Boulder Place
- 1473 Salem Ct
- 1479 Puritan Dr
- 1477 Salem Ct
- 1105 Breakaway Dr
- 5037 Los Morros Way Unit 71
- 4949 Luna Dr
- 881 Panella Ct
- 885 Panella Ct
- 885 Panella Dr Unit 11
- 877 Panella Dr Unit II
- 878 Niguel St
- 882 Niguel St
- 874 Niguel St Unit II
- 889 Panella Dr
- 886 Niguel St Unit II
- 876 Panella Dr
- 880 Panella Dr
- 890 Niguel St
- 872 Panella Dr
- 884 Panella Dr
- 868 Panella Ct
- 4893 Tropea St
- 4897 Tropea St
- 4889 Tropea St
- 888 Panella Ct
- 888 Panella Dr