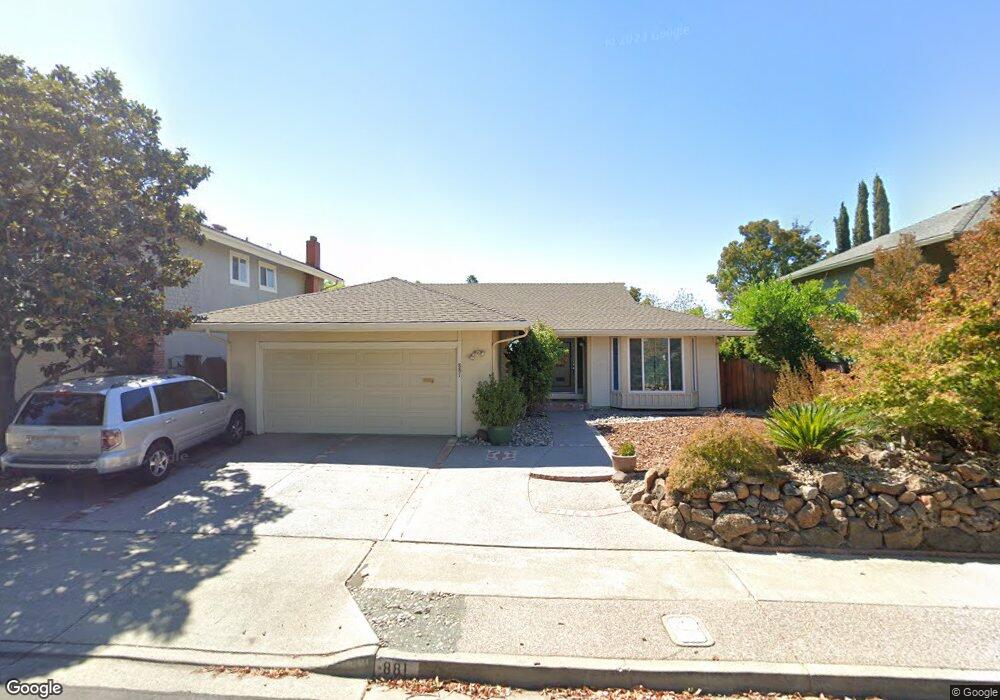
881 San Simeon Dr Concord, CA 94518
Vista Diablo/Wilshire Estates NeighborhoodEstimated Value: $876,000 - $1,047,000
4
Beds
2
Baths
1,712
Sq Ft
$552/Sq Ft
Est. Value
About This Home
This home is located at 881 San Simeon Dr, Concord, CA 94518 and is currently estimated at $944,936, approximately $551 per square foot. 881 San Simeon Dr is a home located in Contra Costa County with nearby schools including Woodside Elementary School, Oak Grove Middle School, and Ygnacio Valley High School.
Ownership History
Date
Name
Owned For
Owner Type
Purchase Details
Closed on
Oct 11, 2017
Sold by
Hamidi Hayatullah and Hamidi Diwa
Bought by
Bra Meghan O
Current Estimated Value
Home Financials for this Owner
Home Financials are based on the most recent Mortgage that was taken out on this home.
Original Mortgage
$636,150
Outstanding Balance
$530,793
Interest Rate
3.78%
Mortgage Type
FHA
Estimated Equity
$414,143
Purchase Details
Closed on
Nov 8, 1999
Sold by
Polermo Ronald W
Bought by
Hamidi Hayatullah and Hamidi Diwa
Home Financials for this Owner
Home Financials are based on the most recent Mortgage that was taken out on this home.
Original Mortgage
$216,800
Interest Rate
7.82%
Mortgage Type
Stand Alone First
Purchase Details
Closed on
Apr 3, 1995
Sold by
Palermo Josephine A
Bought by
Palermo Josephine A
Create a Home Valuation Report for This Property
The Home Valuation Report is an in-depth analysis detailing your home's value as well as a comparison with similar homes in the area
Home Values in the Area
Average Home Value in this Area
Purchase History
| Date | Buyer | Sale Price | Title Company |
|---|---|---|---|
| Bra Meghan O | $660,000 | Placer Title Company | |
| Hamidi Hayatullah | $271,000 | Old Republic Title Company | |
| Palermo Josephine A | -- | -- |
Source: Public Records
Mortgage History
| Date | Status | Borrower | Loan Amount |
|---|---|---|---|
| Open | Bra Meghan O | $636,150 | |
| Previous Owner | Hamidi Hayatullah | $216,800 |
Source: Public Records
Tax History Compared to Growth
Tax History
| Year | Tax Paid | Tax Assessment Tax Assessment Total Assessment is a certain percentage of the fair market value that is determined by local assessors to be the total taxable value of land and additions on the property. | Land | Improvement |
|---|---|---|---|---|
| 2025 | $9,071 | $750,962 | $466,508 | $284,454 |
| 2024 | $8,906 | $736,238 | $457,361 | $278,877 |
| 2023 | $8,906 | $721,803 | $448,394 | $273,409 |
| 2022 | $8,792 | $707,651 | $439,602 | $268,049 |
| 2021 | $8,583 | $693,777 | $430,983 | $262,794 |
| 2019 | $8,423 | $673,200 | $418,200 | $255,000 |
| 2018 | $8,108 | $660,000 | $410,000 | $250,000 |
| 2017 | $4,663 | $358,874 | $139,046 | $219,828 |
| 2016 | $4,524 | $351,838 | $136,320 | $215,518 |
| 2015 | $4,461 | $346,554 | $134,273 | $212,281 |
| 2014 | $4,373 | $339,766 | $131,643 | $208,123 |
Source: Public Records
Map
Nearby Homes
- 2730 Calpine Place
- 2745 Minert Rd
- 889 Madigan Ave
- 2765 Ryan Rd
- 928 Sassel Ave
- 2915 Watson Ct E
- 2605 Ryan Rd
- 946 Notre Dame Ave
- 886 San Miguel Rd
- 3055 Treat Blvd Unit 25
- 3445 Chugach Place
- 810 Oak Grove Rd Unit 83
- 810 Oak Grove Rd Unit 106
- 3051 Treat Blvd Unit 63
- 3051 Treat Blvd Unit 129
- 3015 Lanway Ct
- 2275 Whitman Rd
- 887 Andrix Ct
- 825 Oak Grove Rd Unit 35
- 825 Oak Grove Rd Unit 46
- 879 San Simeon Dr
- 883 San Simeon Dr
- 2854 Lyon Cir
- 2860 Lyon Cir
- 877 San Simeon Dr
- 885 San Simeon Dr
- 2848 Lyon Cir
- 2866 Lyon Cir
- 875 San Simeon Dr
- 887 San Simeon Dr
- 880 San Simeon Dr
- 878 San Simeon Dr
- 882 San Simeon Dr
- 2842 Lyon Cir
- 876 San Simeon Dr
- 2872 Lyon Cir
- 884 San Simeon Dr
- 889 San Simeon Dr
- 873 San Simeon Dr
- 874 San Simeon Dr