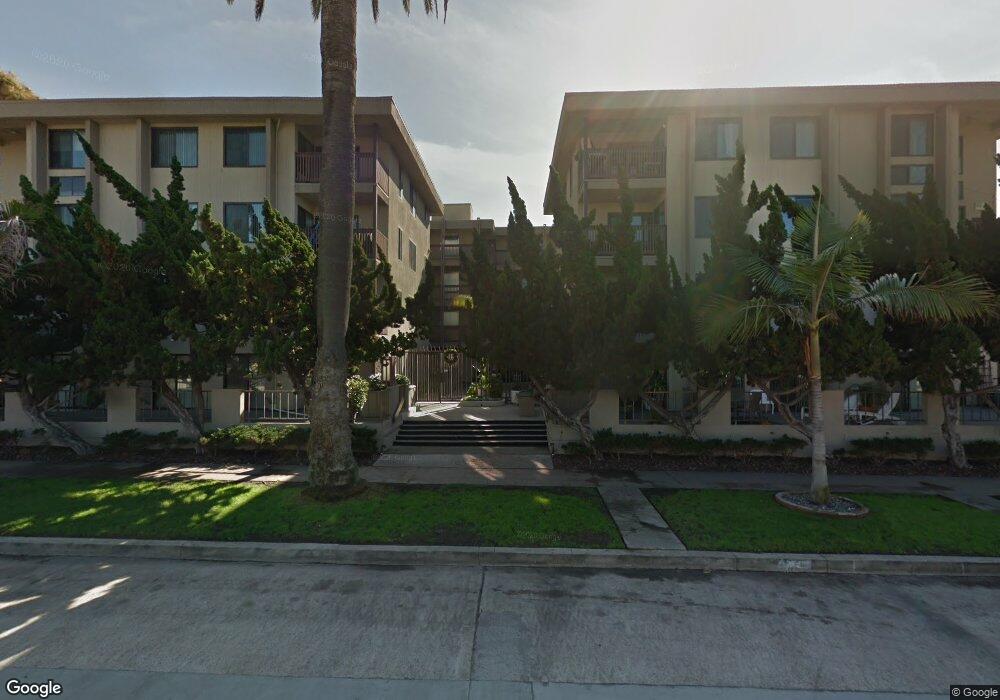
881 Thomas Ave Unit 5 San Diego, CA 92109
Pacific Beach NeighborhoodEstimated Value: $997,000 - $1,222,952
2
Beds
2
Baths
1,362
Sq Ft
$812/Sq Ft
Est. Value
About This Home
This home is located at 881 Thomas Ave Unit 5, San Diego, CA 92109 and is currently estimated at $1,105,738, approximately $811 per square foot. 881 Thomas Ave Unit 5 is a home located in San Diego County with nearby schools including Crown Point Junior Music Academy, Pacific Beach Middle, and Mission Bay High School.
Ownership History
Date
Name
Owned For
Owner Type
Purchase Details
Closed on
Sep 11, 2001
Sold by
Webster Darien C and Webster Amber
Bought by
Silva Jose Luis and Silva Linda Sue
Current Estimated Value
Home Financials for this Owner
Home Financials are based on the most recent Mortgage that was taken out on this home.
Original Mortgage
$150,000
Outstanding Balance
$57,980
Interest Rate
6.87%
Estimated Equity
$1,047,758
Purchase Details
Closed on
Feb 21, 2001
Sold by
Webster Robbie Alan and Webster Concetta
Bought by
Webster Darien C
Purchase Details
Closed on
Mar 29, 1995
Sold by
Guyer Robert L and Richardson Leah R
Bought by
Webster Robbie Alan and Webster Concetta
Home Financials for this Owner
Home Financials are based on the most recent Mortgage that was taken out on this home.
Original Mortgage
$150,900
Interest Rate
4.87%
Create a Home Valuation Report for This Property
The Home Valuation Report is an in-depth analysis detailing your home's value as well as a comparison with similar homes in the area
Home Values in the Area
Average Home Value in this Area
Purchase History
We collect this data history from publicly available records. To have your information removed, we recommend requesting removal directly through your county’s website.
| Date | Buyer | Sale Price | Title Company |
|---|---|---|---|
| Silva Jose Luis | $367,000 | Fidelity National Title | |
| Webster Darien C | -- | -- | |
| Webster Robbie Alan | $189,000 | Stewart Title Company |
Source: Public Records
Mortgage History
We collect this data history from publicly available records. To have your information removed, we recommend requesting removal directly through your county’s website.
| Date | Status | Borrower | Loan Amount |
|---|---|---|---|
| Open | Silva Jose Luis | $150,000 | |
| Previous Owner | Webster Robbie Alan | $150,900 |
Source: Public Records
Tax History
| Year | Tax Paid | Tax Assessment Tax Assessment Total Assessment is a certain percentage of the fair market value that is determined by local assessors to be the total taxable value of land and additions on the property. | Land | Improvement |
|---|---|---|---|---|
| 2025 | $6,816 | $542,145 | $317,609 | $224,536 |
| 2024 | $6,559 | $531,516 | $311,382 | $220,134 |
| 2023 | $6,415 | $521,095 | $305,277 | $215,818 |
| 2022 | $6,244 | $510,879 | $299,292 | $211,587 |
| 2021 | $6,202 | $500,863 | $293,424 | $207,439 |
| 2020 | $6,127 | $495,728 | $290,416 | $205,312 |
| 2019 | $6,018 | $486,009 | $284,722 | $201,287 |
| 2018 | $5,627 | $476,481 | $279,140 | $197,341 |
| 2017 | $5,493 | $467,139 | $273,667 | $193,472 |
| 2016 | $5,406 | $457,980 | $268,301 | $189,679 |
| 2015 | $5,327 | $451,101 | $264,271 | $186,830 |
| 2014 | $5,243 | $442,266 | $259,095 | $183,171 |
Source: Public Records
Map
Nearby Homes
- 881 Thomas Ave Unit 21
- 4111 Bayard St
- 924 Hornblend St Unit 311
- 4475 Mission Blvd Unit 1
- 4465 Ocean Blvd Unit 4
- 1105 Reed Ave
- 1109-1111 Grand
- 1119 Reed Ave Unit 2
- 749 Zanzibar Ct
- 930 Felspar St
- 1147 Hornblend St
- 4667 Ocean Blvd Unit 306
- 3921 Ocean Front Walk
- 1225 Pacific Beach Dr Unit 2E
- 1225 Pacific Beach Dr Unit 1-O
- 1258 Grand Ave
- 4328 Fanuel St
- 1268-70 Grand Unit 1
- 1254 Parker Place
- 1235 Parker Place Unit 2B
- 881 Thomas Ave
- 881 Thomas Ave Unit 17
- 881 Thomas Ave Unit 11
- 881 Thomas Ave Unit 8
- 881 Thomas Ave Unit 7
- 881 Thomas Ave Unit 6
- 881 Thomas Ave Unit 4
- 881 Thomas Ave Unit 3
- 881 Thomas Ave Unit 2
- 881 Thomas Ave Unit 1
- 881 Thomas Ave Unit 26
- 881 Thomas Ave Unit 25
- 881 Thomas Ave Unit 24
- 881 Thomas Ave Unit 23
- 881 Thomas Ave Unit 22
- 881 Thomas Ave Unit 20
- 881 Thomas Ave Unit 19
- 881 Thomas Ave Unit 18
- 881 Thomas Ave Unit 16
- 881 Thomas Ave Unit 15
Your Personal Tour Guide
Ask me questions while you tour the home.