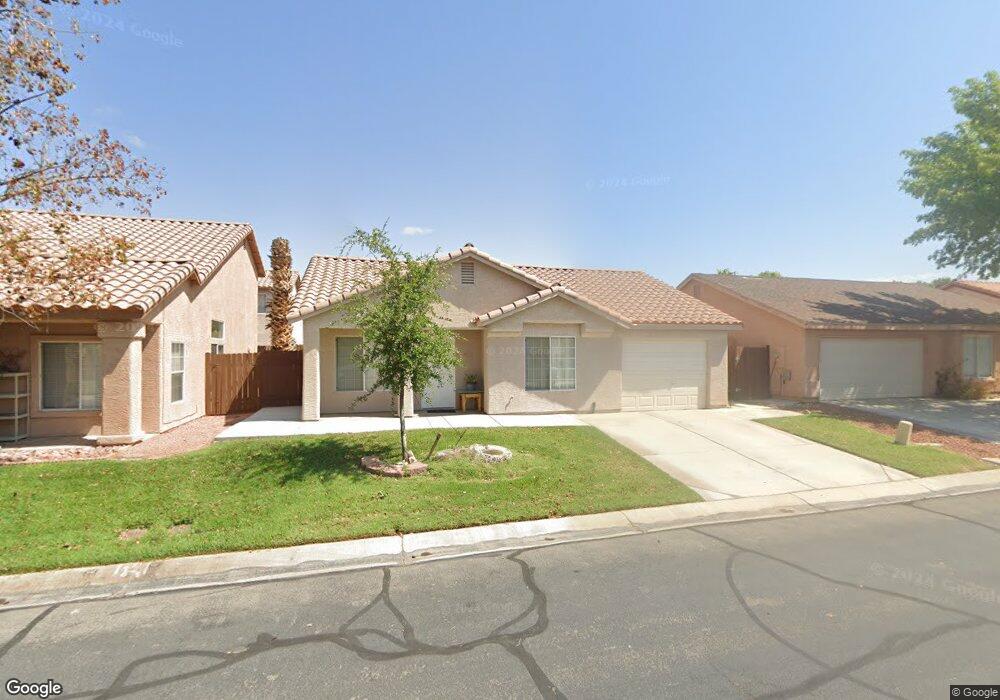
881 Tucson St Mesquite, NV 89027
Estimated Value: $258,000 - $276,000
2
Beds
2
Baths
1,045
Sq Ft
$255/Sq Ft
Est. Value
About This Home
This home is located at 881 Tucson St, Mesquite, NV 89027 and is currently estimated at $266,470, approximately $254 per square foot. 881 Tucson St is a home located in Clark County with nearby schools including Virgin Valley Elementary School, Charles Arthur Hughes Middle School, and Virgin Valley High School.
Ownership History
Date
Name
Owned For
Owner Type
Purchase Details
Closed on
Sep 30, 2003
Sold by
Blair Chris
Bought by
Ortiz Angeles
Current Estimated Value
Home Financials for this Owner
Home Financials are based on the most recent Mortgage that was taken out on this home.
Original Mortgage
$96,414
Outstanding Balance
$66,186
Interest Rate
5.98%
Mortgage Type
Unknown
Estimated Equity
$200,284
Purchase Details
Closed on
Jan 24, 2002
Sold by
Stone Creek Mesquite Llc
Bought by
Blair Chris
Home Financials for this Owner
Home Financials are based on the most recent Mortgage that was taken out on this home.
Original Mortgage
$71,920
Interest Rate
7.11%
Mortgage Type
Credit Line Revolving
Purchase Details
Closed on
Jan 24, 2001
Sold by
Difederico Paula Z
Bought by
Blair Chris
Create a Home Valuation Report for This Property
The Home Valuation Report is an in-depth analysis detailing your home's value as well as a comparison with similar homes in the area
Home Values in the Area
Average Home Value in this Area
Purchase History
| Date | Buyer | Sale Price | Title Company |
|---|---|---|---|
| Ortiz Angeles | $105,950 | Nevada Title Company | |
| Blair Chris | $89,950 | Nevada Title Company | |
| Blair Chris | -- | Nevada Title Company |
Source: Public Records
Mortgage History
| Date | Status | Borrower | Loan Amount |
|---|---|---|---|
| Open | Ortiz Angeles | $96,414 | |
| Previous Owner | Blair Chris | $71,920 |
Source: Public Records
Tax History Compared to Growth
Tax History
| Year | Tax Paid | Tax Assessment Tax Assessment Total Assessment is a certain percentage of the fair market value that is determined by local assessors to be the total taxable value of land and additions on the property. | Land | Improvement |
|---|---|---|---|---|
| 2025 | $996 | $73,069 | $22,050 | $51,019 |
| 2024 | $967 | $73,069 | $22,050 | $51,019 |
| 2023 | $967 | $69,077 | $21,000 | $48,077 |
| 2022 | $939 | $60,790 | $16,800 | $43,990 |
| 2021 | $912 | $57,658 | $15,750 | $41,908 |
| 2020 | $884 | $56,192 | $14,700 | $41,492 |
| 2019 | $858 | $53,771 | $12,950 | $40,821 |
| 2018 | $833 | $49,540 | $10,150 | $39,390 |
| 2017 | $1,249 | $44,813 | $9,100 | $35,713 |
| 2016 | $788 | $40,996 | $8,050 | $32,946 |
| 2015 | $787 | $31,367 | $6,300 | $25,067 |
| 2014 | $764 | $28,020 | $7,000 | $21,020 |
Source: Public Records
Map
Nearby Homes
- 375 Habib Way
- 463 Hagens Aly
- 364 Sam Way
- 294 Sam Way
- Beckett Plan at The Fields
- Weston Plan at The Fields
- Graham Plan at The Fields
- 287 Sam Way
- 254 Reber Dr
- 271 Concord Dr
- 777 2nd St S
- 581 Emperor Ln Unit 1
- 228 Hiawatha Way
- 162 Hermosa Way
- 262 Thistle St
- 517 W Mesquite Blvd
- 844 Sagedell Rd
- 840 W Pioneer
- 844 Glendale Rd
- 1389 Harbour Dr