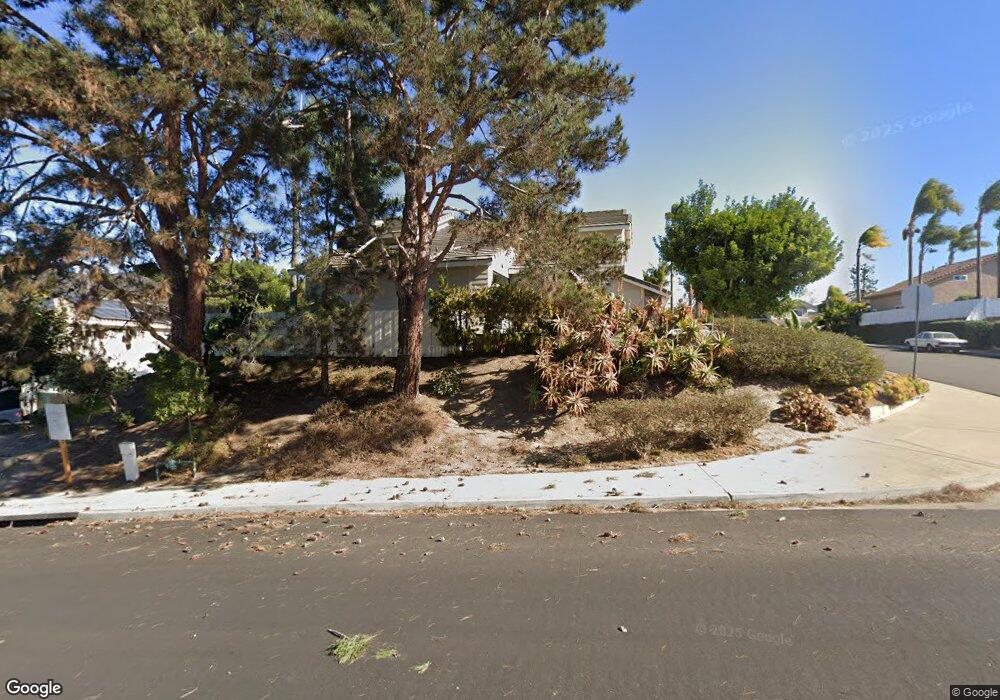
8810 Pipestone Way San Diego, CA 92129
Rancho Peñasquitos NeighborhoodEstimated Value: $1,307,145 - $1,573,000
4
Beds
3
Baths
1,848
Sq Ft
$789/Sq Ft
Est. Value
About This Home
This home is located at 8810 Pipestone Way, San Diego, CA 92129 and is currently estimated at $1,458,036, approximately $788 per square foot. 8810 Pipestone Way is a home located in San Diego County with nearby schools including Deer Canyon Elementary School, Mesa Verde Middle School, and Westview High School.
Ownership History
Date
Name
Owned For
Owner Type
Purchase Details
Closed on
Feb 4, 2023
Sold by
Oleson Vicki
Bought by
Oleson Living Trust and Oleson
Current Estimated Value
Purchase Details
Closed on
Feb 19, 2003
Sold by
Oleson Vicki L
Bought by
Oleson Vicki L
Home Financials for this Owner
Home Financials are based on the most recent Mortgage that was taken out on this home.
Original Mortgage
$196,000
Interest Rate
5.89%
Purchase Details
Closed on
Sep 14, 2000
Sold by
Oleson John E
Bought by
Oleson Vicki L
Purchase Details
Closed on
Oct 8, 1993
Sold by
Kim Ju Young and Kim Sung Hee
Bought by
Oleson John E and Oleson Vicki L
Home Financials for this Owner
Home Financials are based on the most recent Mortgage that was taken out on this home.
Original Mortgage
$184,000
Interest Rate
7.09%
Mortgage Type
VA
Purchase Details
Closed on
Oct 24, 1988
Create a Home Valuation Report for This Property
The Home Valuation Report is an in-depth analysis detailing your home's value as well as a comparison with similar homes in the area
Home Values in the Area
Average Home Value in this Area
Purchase History
| Date | Buyer | Sale Price | Title Company |
|---|---|---|---|
| Oleson Living Trust | -- | None Listed On Document | |
| Oleson Vicki L | -- | Fidelity National Title Co | |
| Oleson Vicki L | -- | -- | |
| Oleson John E | $199,000 | United Title Company | |
| -- | $200,500 | -- |
Source: Public Records
Mortgage History
| Date | Status | Borrower | Loan Amount |
|---|---|---|---|
| Previous Owner | Oleson Vicki L | $196,000 | |
| Previous Owner | Oleson John E | $184,000 |
Source: Public Records
Tax History Compared to Growth
Tax History
| Year | Tax Paid | Tax Assessment Tax Assessment Total Assessment is a certain percentage of the fair market value that is determined by local assessors to be the total taxable value of land and additions on the property. | Land | Improvement |
|---|---|---|---|---|
| 2025 | $3,401 | $338,208 | $106,456 | $231,752 |
| 2024 | $3,401 | $331,577 | $104,369 | $227,208 |
| 2023 | $3,322 | $325,076 | $102,323 | $222,753 |
| 2022 | $3,258 | $318,703 | $100,317 | $218,386 |
| 2021 | $3,194 | $312,454 | $98,350 | $214,104 |
| 2020 | $3,165 | $309,251 | $97,342 | $211,909 |
| 2019 | $3,104 | $303,188 | $95,434 | $207,754 |
| 2018 | $3,040 | $297,244 | $93,563 | $203,681 |
| 2017 | $82 | $291,417 | $91,729 | $199,688 |
| 2016 | $2,908 | $285,704 | $89,931 | $195,773 |
| 2015 | $2,864 | $281,414 | $88,581 | $192,833 |
| 2014 | $2,795 | $275,902 | $86,846 | $189,056 |
Source: Public Records
Map
Nearby Homes
- 8985 Talca Ct
- 8465 Hovenweep Ct
- 14420 Meadowrun St
- 8316 Entreken Way Unit 1
- 13170 Entreken Ave
- 13146 Thunderhead St
- 8183 Doug Hill
- 7855 Via Belfiore Unit 1
- 8114 Sendero de La Pradera
- 8754 Park Run Rd
- 13856 Paseo Cardiel
- 9858 Via Caceres
- 8672 Creekwood Ln
- 13837 Paseo Cardiel
- 13202 Salmon River Rd Unit 101
- 9118 Pimpernel Dr
- 9531 Bayamon Rd
- 9462 Pipilo St
- 9525 High Park Ln
- 12573 Brickellia St
- 8816 Pipestone Way
- 13847 Sparren Ave
- 8822 Pipestone Way
- 13795 Sparren Ave
- 13810 Sparren Ave
- 8915 Rotherham Ave
- 13887 Sparren Ave
- 13848 Sparren Ave
- 8826 Pipestone Way
- 13862 Sparren Ave
- 8925 Rotherham Ave
- 13787 Sparren Ave
- 13940 Gunnison Ct
- 13788 Sparren Ave
- 13882 Sparren Ave
- 8830 Pipestone Way
- 8935 Rotherham Ave
- 13896 Sparren Ave
- 13779 Sparren Ave
- 13932 Gunnison Ct