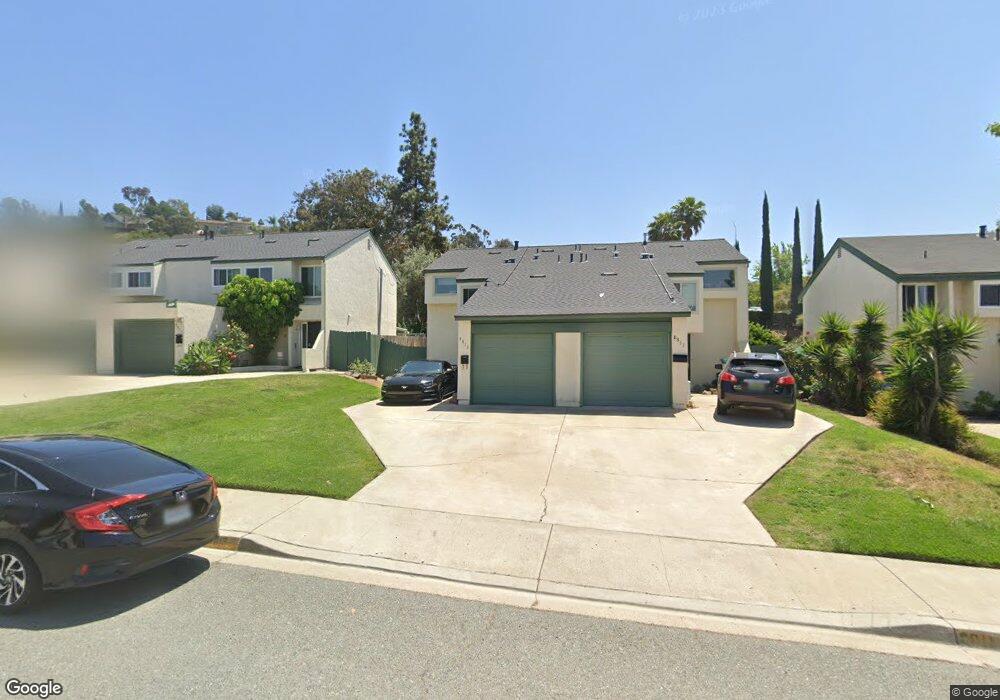
8811 Terrarama Ave Spring Valley, CA 91977
Estimated Value: $583,277 - $619,000
3
Beds
2
Baths
1,125
Sq Ft
$537/Sq Ft
Est. Value
About This Home
This home is located at 8811 Terrarama Ave, Spring Valley, CA 91977 and is currently estimated at $604,319, approximately $537 per square foot. 8811 Terrarama Ave is a home located in San Diego County with nearby schools including Bancroft Elementary School, Science, Technology, Engineering, Arts, And Math Academy, and Mount Miguel High School.
Ownership History
Date
Name
Owned For
Owner Type
Purchase Details
Closed on
Apr 25, 2000
Sold by
Bedsole Grace G
Bought by
Bedsole Hope A
Current Estimated Value
Purchase Details
Closed on
Jun 21, 1999
Sold by
Beamon Dave and Beamon Heather J
Bought by
Bedsole Grace G and Bedsole Hope A
Purchase Details
Closed on
Apr 7, 1999
Sold by
Va
Bought by
Beamon Dave and Beamon Heather J
Home Financials for this Owner
Home Financials are based on the most recent Mortgage that was taken out on this home.
Original Mortgage
$89,100
Interest Rate
7.04%
Mortgage Type
Seller Take Back
Purchase Details
Closed on
Jun 11, 1998
Sold by
Norwest Mtg Inc
Bought by
Va
Purchase Details
Closed on
Sep 10, 1990
Purchase Details
Closed on
May 9, 1988
Create a Home Valuation Report for This Property
The Home Valuation Report is an in-depth analysis detailing your home's value as well as a comparison with similar homes in the area
Home Values in the Area
Average Home Value in this Area
Purchase History
| Date | Buyer | Sale Price | Title Company |
|---|---|---|---|
| Bedsole Hope A | -- | United Title Company | |
| Bedsole Grace G | -- | -- | |
| Beamon Dave | $90,000 | First American Title | |
| Va | -- | Benefit Land Title Ins Compa | |
| Norwest Mtg Inc | $80,869 | Benefit Land Title Ins Compa | |
| -- | $109,900 | -- | |
| -- | $85,500 | -- |
Source: Public Records
Mortgage History
| Date | Status | Borrower | Loan Amount |
|---|---|---|---|
| Previous Owner | Beamon Dave | $89,100 |
Source: Public Records
Tax History Compared to Growth
Tax History
| Year | Tax Paid | Tax Assessment Tax Assessment Total Assessment is a certain percentage of the fair market value that is determined by local assessors to be the total taxable value of land and additions on the property. | Land | Improvement |
|---|---|---|---|---|
| 2025 | $2,557 | $173,651 | $61,465 | $112,186 |
| 2024 | $2,557 | $170,247 | $60,260 | $109,987 |
| 2023 | $2,469 | $166,910 | $59,079 | $107,831 |
| 2022 | $2,415 | $163,638 | $57,921 | $105,717 |
| 2021 | $2,396 | $160,431 | $56,786 | $103,645 |
| 2020 | $2,291 | $158,787 | $56,204 | $102,583 |
| 2019 | $2,254 | $155,674 | $55,102 | $100,572 |
| 2018 | $2,167 | $152,622 | $54,022 | $98,600 |
| 2017 | $832 | $149,630 | $52,963 | $96,667 |
| 2016 | $2,007 | $146,697 | $51,925 | $94,772 |
| 2015 | $1,989 | $144,495 | $51,146 | $93,349 |
| 2014 | $1,955 | $141,666 | $50,145 | $91,521 |
Source: Public Records
Map
Nearby Homes
- 8837 Ildica St
- 1830 Helix St
- 2000 Crofton St Unit SPC 39
- 1815 Sweetwater Rd Unit 155
- 1815 Sweetwater Rd Unit SPC 121
- 1815 Sweetwater Rd Unit 37
- 1815 Sweetwater Rd Unit SPC 48
- 1815 Sweetwater Rd Unit SPC 120
- 1815 Sweetwater Rd Unit 111
- 1815 Sweetwater Rd Unit 22
- 2256 Kings View Cir
- 9077 Avocado St
- 2018 Barite St
- 8576 Blossom Ln
- 2163 Helix St
- 8886 Margaret Ct
- 8681 Eileen St
- 8603 Eileen St
- 8920 King Michael Ct
- 9180 Tokaj Ln
- 8813 Terrarama Ave
- 8819 Terrarama Ave
- 8805 Terrarama Ave
- 8807 Terrarama Ave
- 8817 Terrarama Ave
- 2011 Terrakappa Ave
- 2009 Terrakappa Ave
- 8823 Terrarama Ave
- 8825 Terrarama Ave
- 8812 Terrarama Ave
- 2003 Terrakappa Ave
- 8810 Terrarama Ave
- 8806 Terrarama Ave
- 2001 Terrakappa Ave
- 8818 Terrarama Ave
- 8831 Terrarama Ave Unit X
- 8824 Terrarama Ave
- 8822 Terrarama Ave
- 8829 Terrarama Ave
- 2018 Terrakappa Ave