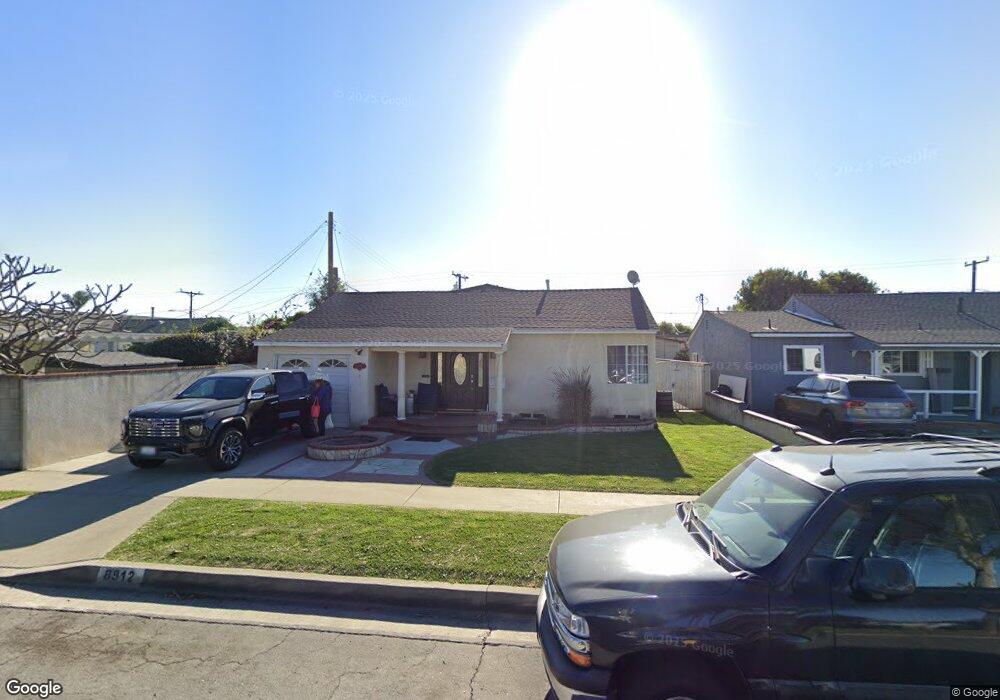
8812 Clarinda Ave Pico Rivera, CA 90660
Estimated Value: $780,000 - $950,000
4
Beds
2
Baths
1,670
Sq Ft
$506/Sq Ft
Est. Value
About This Home
This home is located at 8812 Clarinda Ave, Pico Rivera, CA 90660 and is currently estimated at $844,268, approximately $505 per square foot. 8812 Clarinda Ave is a home located in Los Angeles County with nearby schools including Birney Tech Academy, The STEAM Academy @ Burke, and El Rancho High School.
Ownership History
Date
Name
Owned For
Owner Type
Purchase Details
Closed on
Jan 20, 2016
Sold by
Campos Tevy
Bought by
Campos Tevy
Current Estimated Value
Home Financials for this Owner
Home Financials are based on the most recent Mortgage that was taken out on this home.
Original Mortgage
$187,500
Outstanding Balance
$79,614
Interest Rate
3.94%
Mortgage Type
New Conventional
Estimated Equity
$764,654
Purchase Details
Closed on
Jul 9, 2002
Sold by
Campos Miguel
Bought by
Campos Tevy
Home Financials for this Owner
Home Financials are based on the most recent Mortgage that was taken out on this home.
Original Mortgage
$130,342
Interest Rate
6.24%
Purchase Details
Closed on
Mar 10, 1997
Sold by
England Audis I
Bought by
Campos Miguel and Campos Tevy
Home Financials for this Owner
Home Financials are based on the most recent Mortgage that was taken out on this home.
Original Mortgage
$132,557
Interest Rate
7.98%
Mortgage Type
FHA
Create a Home Valuation Report for This Property
The Home Valuation Report is an in-depth analysis detailing your home's value as well as a comparison with similar homes in the area
Home Values in the Area
Average Home Value in this Area
Purchase History
| Date | Buyer | Sale Price | Title Company |
|---|---|---|---|
| Campos Tevy | -- | Lawyers Title | |
| Campos Tevy | -- | Lawyers Title | |
| Campos Tevy | -- | Gateway Title Company | |
| Campos Miguel | $134,000 | California Counties Title Co |
Source: Public Records
Mortgage History
| Date | Status | Borrower | Loan Amount |
|---|---|---|---|
| Open | Campos Tevy | $187,500 | |
| Closed | Campos Tevy | $130,342 | |
| Previous Owner | Campos Miguel | $132,557 |
Source: Public Records
Tax History Compared to Growth
Tax History
| Year | Tax Paid | Tax Assessment Tax Assessment Total Assessment is a certain percentage of the fair market value that is determined by local assessors to be the total taxable value of land and additions on the property. | Land | Improvement |
|---|---|---|---|---|
| 2025 | $4,778 | $311,496 | $142,822 | $168,674 |
| 2024 | $4,778 | $305,389 | $140,022 | $165,367 |
| 2023 | $4,652 | $299,402 | $137,277 | $162,125 |
| 2022 | $4,450 | $293,533 | $134,586 | $158,947 |
| 2021 | $4,333 | $287,779 | $131,948 | $155,831 |
| 2019 | $4,304 | $279,246 | $128,036 | $151,210 |
| 2018 | $4,002 | $273,772 | $125,526 | $148,246 |
| 2016 | $3,614 | $263,143 | $120,652 | $142,491 |
| 2015 | $3,561 | $259,191 | $118,840 | $140,351 |
| 2014 | $3,520 | $254,115 | $116,513 | $137,602 |
Source: Public Records
Map
Nearby Homes
- 8736 Klinedale Ave
- 9602 Florpark St
- 8849 Pico Vista Rd
- 9636 Cedartree Rd
- 9430 True Ave
- 9311 Claymore St
- 9950 La Docena Ln
- 9822 Bartley Ave
- 8328 Buhman Ave
- 9910 Aspen Cir
- 11418 Flossmoor Rd
- 9729 Homestead St
- 9813 Houghton Ave
- 9123 Lemoran Ave
- 11032 Davenrich St
- 11523 Willins St
- 11526 Promenade Dr
- 11544 Promenade Dr
- 8216 Chaney Ave
- 11571 Telegraph Rd
- 8818 Clarinda Ave
- 9708 Hamden St
- 8804 Clarinda Ave
- 9712 Hamden St
- 8822 Clarinda Ave
- 9718 Hamden St
- 8817 True Ave
- 8823 True Ave
- 8828 Clarinda Ave
- 8827 True Ave
- 9724 Hamden St
- 8833 True Ave
- 8832 Clarinda Ave
- 8815 Clarinda Ave
- 8809 Clarinda Ave
- 8805 True Ave
- 8823 Clarinda Ave
- 8730 Clarinda Ave
- 8839 True Ave
- 8801 Clarinda Ave