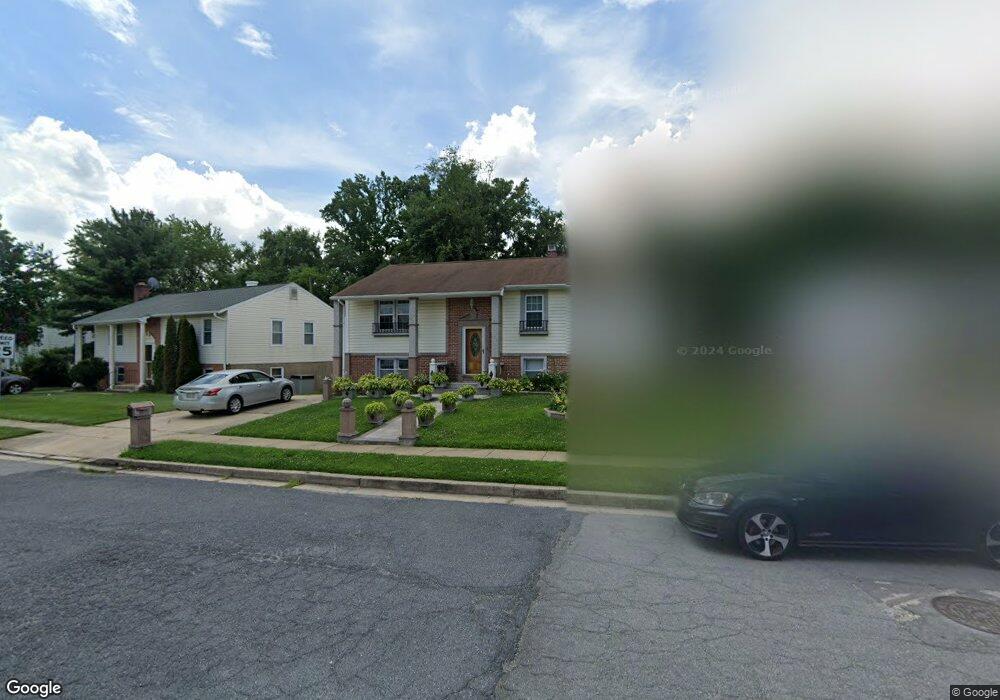
8812 Dearborn Dr Nottingham, MD 21236
Estimated Value: $299,336 - $390,000
--
Bed
1
Bath
1,048
Sq Ft
$327/Sq Ft
Est. Value
About This Home
This home is located at 8812 Dearborn Dr, Nottingham, MD 21236 and is currently estimated at $342,834, approximately $327 per square foot. 8812 Dearborn Dr is a home located in Baltimore County with nearby schools including Perry Hall Elementary School, Perry Hall Middle School, and Perry Hall High School.
Ownership History
Date
Name
Owned For
Owner Type
Purchase Details
Closed on
May 3, 2019
Sold by
Poole Leslie A and Poole Daniel
Bought by
Poole Leslie
Current Estimated Value
Home Financials for this Owner
Home Financials are based on the most recent Mortgage that was taken out on this home.
Original Mortgage
$232,057
Outstanding Balance
$201,475
Interest Rate
3.6%
Mortgage Type
FHA
Estimated Equity
$141,359
Purchase Details
Closed on
May 13, 2017
Sold by
Garst Leslie A and Poole Leslie A
Bought by
Poole Leslie A and Poole Daniel
Home Financials for this Owner
Home Financials are based on the most recent Mortgage that was taken out on this home.
Original Mortgage
$190,272
Interest Rate
4.1%
Mortgage Type
FHA
Purchase Details
Closed on
Nov 16, 2004
Sold by
Brown Lelia Anne
Bought by
Garst Leslie A
Purchase Details
Closed on
May 18, 2004
Sold by
Brown Lelia Anne
Bought by
Brown Lelia Anne
Purchase Details
Closed on
Oct 24, 2003
Sold by
Brown Calvin D
Bought by
Brown Lelia A
Purchase Details
Closed on
Dec 15, 2000
Sold by
Brown Calvin D
Bought by
Brown Calvin D and Brown Lelia A
Create a Home Valuation Report for This Property
The Home Valuation Report is an in-depth analysis detailing your home's value as well as a comparison with similar homes in the area
Home Values in the Area
Average Home Value in this Area
Purchase History
| Date | Buyer | Sale Price | Title Company |
|---|---|---|---|
| Poole Leslie | -- | Xpress Title Services Llc | |
| Poole Leslie A | -- | Xpress Title Services Llc | |
| Garst Leslie A | $200,000 | -- | |
| Brown Lelia Anne | -- | -- | |
| Brown Lelia A | -- | -- | |
| Brown Calvin D | -- | -- |
Source: Public Records
Mortgage History
| Date | Status | Borrower | Loan Amount |
|---|---|---|---|
| Open | Poole Leslie | $232,057 | |
| Closed | Poole Leslie A | $190,272 |
Source: Public Records
Tax History Compared to Growth
Tax History
| Year | Tax Paid | Tax Assessment Tax Assessment Total Assessment is a certain percentage of the fair market value that is determined by local assessors to be the total taxable value of land and additions on the property. | Land | Improvement |
|---|---|---|---|---|
| 2025 | $3,750 | $226,400 | $90,000 | $136,400 |
| 2024 | $3,750 | $226,400 | $90,000 | $136,400 |
| 2023 | $1,952 | $236,800 | $88,500 | $148,300 |
| 2022 | $3,799 | $232,200 | $0 | $0 |
| 2021 | $3,362 | $227,600 | $0 | $0 |
| 2020 | $3,362 | $223,000 | $88,500 | $134,500 |
| 2019 | $3,252 | $212,900 | $0 | $0 |
| 2018 | $3,346 | $202,800 | $0 | $0 |
| 2017 | $3,195 | $192,700 | $0 | $0 |
| 2016 | $2,609 | $187,767 | $0 | $0 |
| 2015 | $2,609 | $182,833 | $0 | $0 |
| 2014 | $2,609 | $177,900 | $0 | $0 |
Source: Public Records
Map
Nearby Homes
- 8806 Dearborn Dr
- 22 Bryce Ct
- 3905 Darleigh Rd Unit F
- 3907 Hannon Ct Unit 2A
- 4003 Jacinth Way
- 4411 Ebenezer Rd
- 3901 Darleigh Rd Unit 1E
- 8929 Yvonne Ave
- 22 Hobb Ct
- 3800 Meghan Dr Unit 1A
- 8505 Castlemill Cir
- 4106 Chardel Rd Unit 2G
- 9017 Hedgerow Way
- 8530 Castlemill Cir
- 4401 E Joppa Rd
- 9026 Carlisle Ave
- 9 Menteith Ct
- 8623 Saxon Cir
- 0 Silver Spring Rd
- 10 Gamewell Garth
- 8810 Dearborn Dr
- 8808 Dearborn Dr
- 8804 Dearborn Dr
- 8813 Dearborn Dr
- 8807 Dearborn Dr
- 8814 Dearborn Dr
- 8815 Dearborn Dr
- 8803 Parlo Rd
- 8811 Dearborn Dr
- 4 Farwell Ct
- 8816 Dearborn Dr
- 1 Farwell Ct
- 8800 Dearborn Dr
- 8817 Dearborn Dr
- 8 Farwell Ct
- 8805 Parlo Rd
- 8900 Parlo Rd
- 3 Farwell Ct
- 8818 Dearborn Dr
- 8819 Dearborn Dr