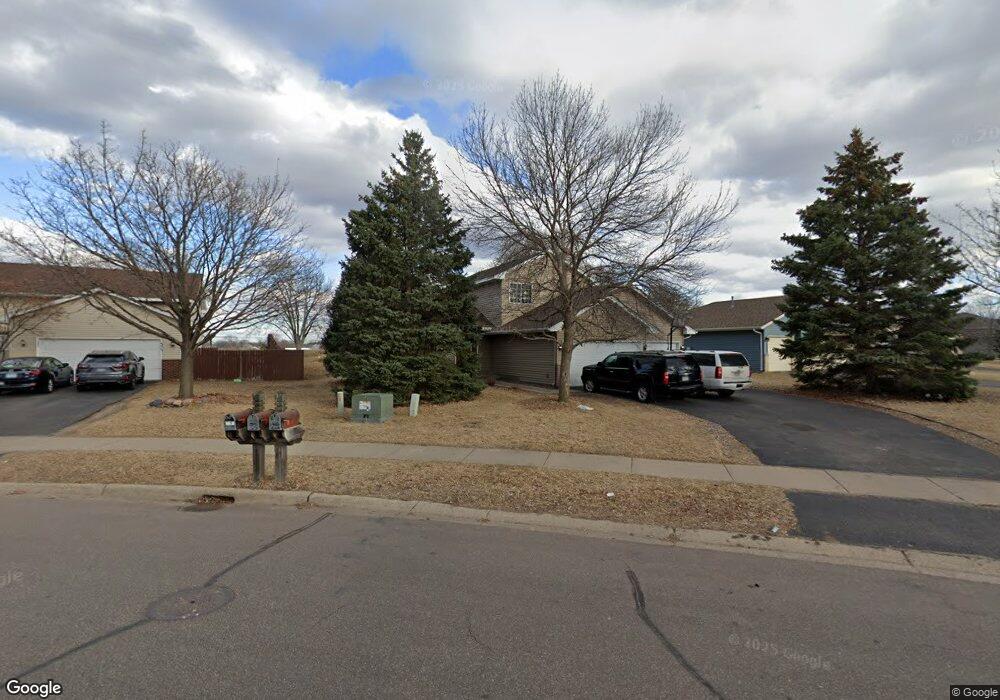
8812 Douglas Dr N Brooklyn Park, MN 55445
Tessman NeighborhoodEstimated Value: $435,000 - $465,000
5
Beds
2
Baths
1,920
Sq Ft
$232/Sq Ft
Est. Value
About This Home
This home is located at 8812 Douglas Dr N, Brooklyn Park, MN 55445 and is currently estimated at $445,604, approximately $232 per square foot. 8812 Douglas Dr N is a home located in Hennepin County with nearby schools including Edinbrook Elementary School, North View Middle School, and Osseo Senior High School.
Ownership History
Date
Name
Owned For
Owner Type
Purchase Details
Closed on
Jan 13, 2021
Sold by
Bekuto Marcos and Berisso Soreti
Bought by
High Opportunity Neighborhood Ii Llc
Current Estimated Value
Purchase Details
Closed on
Feb 20, 2015
Sold by
Bekuto Marcos and Berisso Soreti
Bought by
Pennymac Loan Services Llc
Purchase Details
Closed on
May 23, 2008
Sold by
Us Bank Na
Bought by
Bekuto Marcos and Berisso Soreti
Purchase Details
Closed on
Jul 27, 2005
Sold by
Cage Willie and Cage Rachel
Bought by
Turner Erin
Purchase Details
Closed on
Jul 30, 2001
Sold by
Reynolds Leslie J
Bought by
Cage Willie and Cage Rachel
Purchase Details
Closed on
Apr 30, 1996
Sold by
Lyman Development Co
Bought by
Shade Tree Construction Inc
Purchase Details
Closed on
Feb 17, 1996
Sold by
Shade Tree Construction Inc
Bought by
Montpetit James A and Rupp Kimberly D
Create a Home Valuation Report for This Property
The Home Valuation Report is an in-depth analysis detailing your home's value as well as a comparison with similar homes in the area
Home Values in the Area
Average Home Value in this Area
Purchase History
| Date | Buyer | Sale Price | Title Company |
|---|---|---|---|
| High Opportunity Neighborhood Ii Llc | $352,500 | The Title Group Inc | |
| Pennymac Loan Services Llc | $189,771 | None Available | |
| Bekuto Marcos | $199,750 | -- | |
| Turner Erin | $315,000 | -- | |
| Cage Willie | $2,444,428 | -- | |
| Reynolds Leslie J | $233,500 | -- | |
| Shade Tree Construction Inc | $29,900 | -- | |
| Montpetit James A | $131,135 | -- | |
| -- | $352,500 | -- |
Source: Public Records
Mortgage History
| Date | Status | Borrower | Loan Amount |
|---|---|---|---|
| Closed | Cage Willie | -- |
Source: Public Records
Tax History Compared to Growth
Tax History
| Year | Tax Paid | Tax Assessment Tax Assessment Total Assessment is a certain percentage of the fair market value that is determined by local assessors to be the total taxable value of land and additions on the property. | Land | Improvement |
|---|---|---|---|---|
| 2024 | $7,304 | $404,500 | $130,000 | $274,500 |
| 2023 | $5,888 | $405,600 | $130,000 | $275,600 |
| 2022 | $4,788 | $421,900 | $127,500 | $294,400 |
| 2021 | $4,741 | $340,700 | $68,000 | $272,700 |
| 2020 | $4,963 | $286,800 | $68,000 | $218,800 |
| 2019 | $5,524 | $275,400 | $68,000 | $207,400 |
| 2018 | $5,071 | $287,800 | $60,200 | $227,600 |
| 2017 | $4,913 | $250,000 | $60,200 | $189,800 |
| 2016 | $5,127 | $251,100 | $60,200 | $190,900 |
| 2015 | $5,460 | $237,500 | $50,200 | $187,300 |
| 2014 | -- | $221,300 | $50,200 | $171,100 |
Source: Public Records
Map
Nearby Homes
- 6508 88th Ave N
- 6236 Creekview Ln N
- 8614 Tessman Pkwy N
- 8657 Tessman Cir N
- 9218 Georgia Ave N
- 7216 89th Ave N
- 6614 84th Ct N
- 8400 Brunswick Ave N
- 6415 84th Ct N
- 6523 84th Ct N Unit 6523
- 6526 83rd Ct N
- 8426 Yates Ave N
- 5333 89th Crescent Cir N
- 5203 Kings Crossing
- 8357 Jersey Ave N
- 6517 83rd Ct N
- 9200 Woodhall Bay N
- 5932 83rd Pkwy N
- 6716 83rd Ave N
- 8233 Hampshire Ct N
- 8806 Douglas Dr N
- 8824 Douglas Dr N
- 8813 Douglas Dr N
- 8736 Douglas Dr N
- 8819 Douglas Ct N
- 8807 Douglas Dr N
- 8830 Douglas Dr N
- 8801 Douglas Dr N
- 6400 88th Ave N
- 8823 Douglas Ct N
- 8730 Douglas Dr N
- 8836 Douglas Dr N
- 8741 Douglas Dr N
- 6408 88th Ave N
- 6401 88th Ave N
- 8827 Douglas Ct N
- 8724 Douglas Dr N
- 8735 Douglas Dr N
- 8842 Douglas Dr N
- 8831 Douglas Ct N