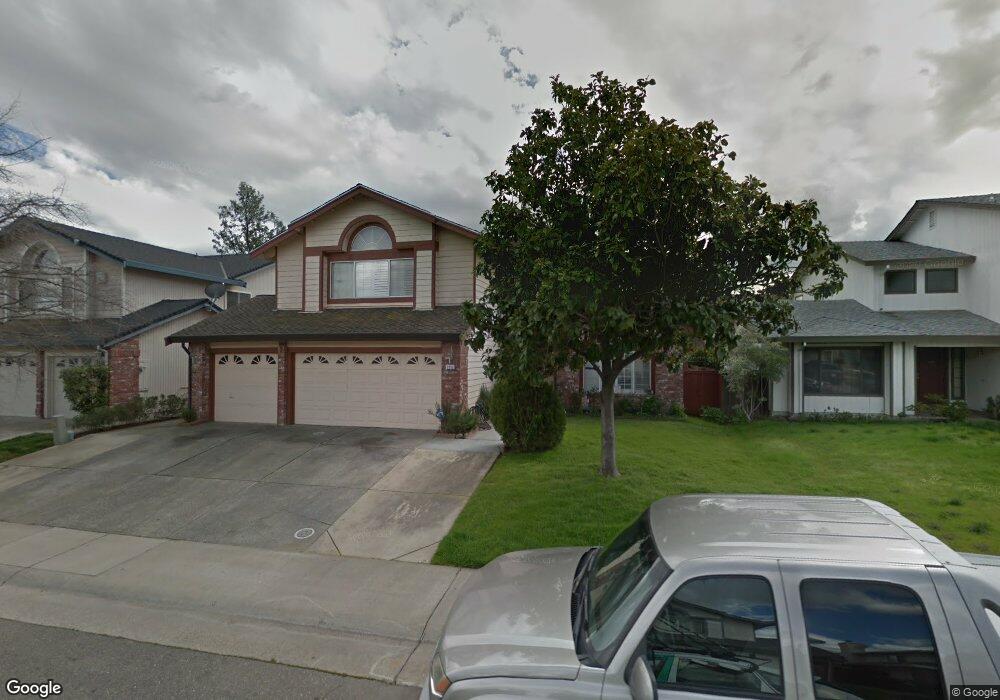
8812 Inisheer Way Sacramento, CA 95828
Estimated Value: $413,000 - $675,000
5
Beds
3
Baths
2,737
Sq Ft
$213/Sq Ft
Est. Value
About This Home
This home is located at 8812 Inisheer Way, Sacramento, CA 95828 and is currently estimated at $583,422, approximately $213 per square foot. 8812 Inisheer Way is a home located in Sacramento County with nearby schools including Mary Tsukamoto Elementary School, T. R. Smedberg Middle School, and Sheldon High School.
Ownership History
Date
Name
Owned For
Owner Type
Purchase Details
Closed on
Aug 23, 2020
Sold by
Franco Carlos Rose
Bought by
Singh Sandeep Kaur
Current Estimated Value
Purchase Details
Closed on
Jul 22, 1997
Sold by
Ocwen Federal Bank Fsb
Bought by
Singh Harbans and Singh Satwant Kaur
Home Financials for this Owner
Home Financials are based on the most recent Mortgage that was taken out on this home.
Original Mortgage
$42,000
Outstanding Balance
$5,424
Interest Rate
6.37%
Estimated Equity
$577,998
Purchase Details
Closed on
Dec 23, 1996
Sold by
Great Western Bank Fsb
Bought by
Ocwen Federal Bank Fsb
Purchase Details
Closed on
Dec 4, 1996
Sold by
Ordonez Philip V and Ordonez Carmelita R
Bought by
Great Western Bank Fsb
Create a Home Valuation Report for This Property
The Home Valuation Report is an in-depth analysis detailing your home's value as well as a comparison with similar homes in the area
Home Values in the Area
Average Home Value in this Area
Purchase History
| Date | Buyer | Sale Price | Title Company |
|---|---|---|---|
| Singh Sandeep Kaur | -- | None Available | |
| Singh Harbans | -- | None Available | |
| Singh Harbans | $150,000 | Chicago Title Co | |
| Ocwen Federal Bank Fsb | -- | -- | |
| Great Western Bank Fsb | $94,057 | Chicago Title |
Source: Public Records
Mortgage History
| Date | Status | Borrower | Loan Amount |
|---|---|---|---|
| Open | Singh Harbans | $42,000 |
Source: Public Records
Tax History Compared to Growth
Tax History
| Year | Tax Paid | Tax Assessment Tax Assessment Total Assessment is a certain percentage of the fair market value that is determined by local assessors to be the total taxable value of land and additions on the property. | Land | Improvement |
|---|---|---|---|---|
| 2025 | $2,672 | $239,482 | $63,853 | $175,629 |
| 2024 | $2,672 | $234,787 | $62,601 | $172,186 |
| 2023 | $2,607 | $230,184 | $61,374 | $168,810 |
| 2022 | $2,564 | $225,671 | $60,171 | $165,500 |
| 2021 | $2,536 | $221,247 | $58,992 | $162,255 |
| 2020 | $2,503 | $218,980 | $58,388 | $160,592 |
| 2019 | $2,459 | $214,688 | $57,244 | $157,444 |
| 2018 | $2,396 | $210,479 | $56,122 | $154,357 |
| 2017 | $2,355 | $206,353 | $55,022 | $151,331 |
| 2016 | $2,242 | $202,308 | $53,944 | $148,364 |
| 2015 | $2,202 | $199,270 | $53,134 | $146,136 |
| 2014 | $2,167 | $195,368 | $52,094 | $143,274 |
Source: Public Records
Map
Nearby Homes
- 8836 Inisheer Way
- 8772 Crusheen Way
- 8902 Cobble Crest Dr
- 8906 Cobble Crest Dr
- 8269 Red Rock Dr
- 8643 Rothenburg Ct
- 8247 Derbyshire Cir
- 8809 Coral Berry Way
- 8805 Coral Berry Way
- Plan 1 at Heartstone
- Plan 2 at Heartstone
- Plan 3 at Heartstone
- 8916 Hollowstone Way
- 8990 Chantal Way
- 8216 Exbourne Cir
- 8352 Tannic Dr
- 9028 Brittany Park Dr
- 9065 Robbins Rd
- 8578 Hydrangea Ct
- 8041 Lomand Ct
- 8808 Inisheer Way
- 8816 Inisheer Way
- 8803 Liscarney Way
- 8804 Inisheer Way
- 8820 Inisheer Way
- 8807 Liscarney Way
- 8799 Liscarney Way
- 8809 Inisheer Way
- 8813 Inisheer Way
- 8811 Liscarney Way
- 8805 Inisheer Way
- 8795 Liscarney Way
- 8800 Inisheer Way
- 8824 Inisheer Way
- 8817 Inisheer Way
- 8801 Inisheer Way
- 8815 Liscarney Way
- 8791 Liscarney Way
- 8823 Inisheer Way
- 8794 Inisheer Way