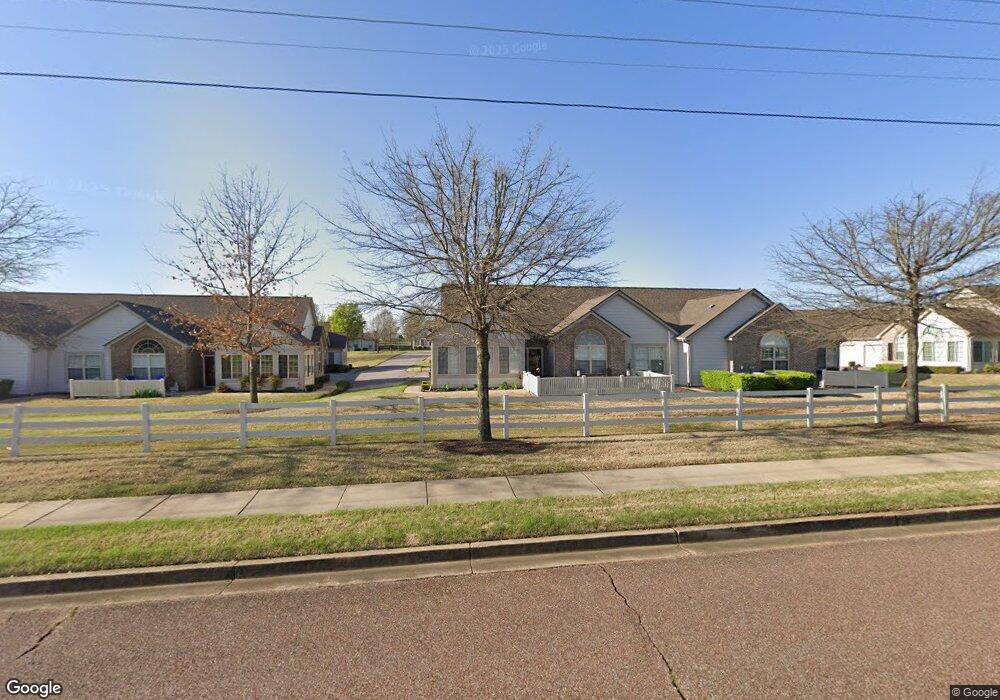
8812 Parkview Oaks Cir Olive Branch, MS 38654
Estimated Value: $287,362 - $308,000
3
Beds
2
Baths
2,216
Sq Ft
$133/Sq Ft
Est. Value
About This Home
This home is located at 8812 Parkview Oaks Cir, Olive Branch, MS 38654 and is currently estimated at $295,341, approximately $133 per square foot. 8812 Parkview Oaks Cir is a home located in DeSoto County with nearby schools including Chickasaw Elementary School, Olive Branch Middle School, and Olive Branch High School.
Ownership History
Date
Name
Owned For
Owner Type
Purchase Details
Closed on
Jan 20, 2021
Sold by
Liles Robert J and Liles Barbara N
Bought by
Rucker Catherine Feathers
Current Estimated Value
Home Financials for this Owner
Home Financials are based on the most recent Mortgage that was taken out on this home.
Original Mortgage
$165,000
Outstanding Balance
$147,263
Interest Rate
2.71%
Mortgage Type
New Conventional
Estimated Equity
$148,078
Purchase Details
Closed on
Jun 5, 2018
Sold by
Wheeler Carl A
Bought by
Liles Robert J and Liles Barbara N
Purchase Details
Closed on
Nov 30, 2011
Sold by
Kemmons Wilson Inc
Bought by
Beeman Richard L and Beeman Brenda K
Home Financials for this Owner
Home Financials are based on the most recent Mortgage that was taken out on this home.
Original Mortgage
$86,000
Interest Rate
4.06%
Mortgage Type
New Conventional
Create a Home Valuation Report for This Property
The Home Valuation Report is an in-depth analysis detailing your home's value as well as a comparison with similar homes in the area
Home Values in the Area
Average Home Value in this Area
Purchase History
| Date | Buyer | Sale Price | Title Company |
|---|---|---|---|
| Rucker Catherine Feathers | -- | Guardian Title Llc | |
| Liles Robert J | -- | None Available | |
| Beeman Richard L | -- | None Available |
Source: Public Records
Mortgage History
| Date | Status | Borrower | Loan Amount |
|---|---|---|---|
| Open | Rucker Catherine Feathers | $165,000 | |
| Previous Owner | Beeman Richard L | $86,000 |
Source: Public Records
Tax History Compared to Growth
Tax History
| Year | Tax Paid | Tax Assessment Tax Assessment Total Assessment is a certain percentage of the fair market value that is determined by local assessors to be the total taxable value of land and additions on the property. | Land | Improvement |
|---|---|---|---|---|
| 2024 | $888 | $14,003 | $2,130 | $11,873 |
| 2023 | $888 | $14,003 | $0 | $0 |
| 2022 | $888 | $14,003 | $2,130 | $11,873 |
| 2021 | $1,911 | $14,003 | $2,130 | $11,873 |
| 2020 | $1,782 | $13,054 | $2,130 | $10,924 |
| 2019 | $1,782 | $13,054 | $2,130 | $10,924 |
| 2017 | $1,441 | $23,252 | $12,691 | $10,561 |
| 2016 | $1,741 | $12,691 | $2,130 | $10,561 |
| 2015 | $1,741 | $23,252 | $12,691 | $10,561 |
| 2014 | $758 | $13,024 | $0 | $0 |
| 2013 | $326 | $13,024 | $0 | $0 |
Source: Public Records
Map
Nearby Homes
- 8817 Parkview Oaks Cir
- 8799 Parkview Oaks Cir
- 8897 Parkview Oaks Cir
- 8710 Parkview Oaks Cir
- 8729 Parkview Oaks Cir
- 8911 Oak Branch Ln
- 8834 Purple Martin Dr
- 8649 Parkview Oaks Cir
- 8653 Parkview Oaks Cir
- 6843 Pink Warbler Ln
- 0 Old Goodman Rd Unit 4081735
- 11282 Vicki's Ln
- 0 Caroma Unit 4006992
- 0 Caroma Unit 10199426
- 6748 Cockrum Rd
- 8654 Goodman Rd
- 8568 Goodman Rd
- 0 Westbranch Rd
- 9270 College St
- 8484 Goodman Rd
- 8812 Parkview Oaks Cir Unit 38
- 8804 Parkview Oaks Cir
- 8804 Parkview Oaks Cir Unit 37
- 8806 Parkview Oaks Cir Unit 39
- 8806 Parkview Oaks Cir
- 8828 Parkview Oaks Cir Unit 29
- 8828 Parkview Oaks Cir
- 8798 Parkview Oaks Cir Unit 40
- 8798 Parkview Oaks Cir
- 8836 Parkview Oaks Cir Unit 30
- 8836 Parkview Oaks Cir
- 8822 Parkview Oaks Cir
- 8788 Parkview Oaks Cir Unit 46
- 8788 Parkview Oaks Cir
- 8782 Parkview Oaks Cir Unit 47
- 8782 Parkview Oaks Cir
- 8830 Parkview Oaks Cir
- 8780 Parkview Oaks Cir Unit 45
- 8780 Parkview Oaks Cir
- 8774 Parkview Oaks Cir Unit 48