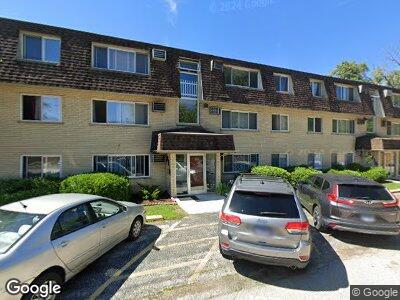
8814 Briar Ct Unit 88142B Des Plaines, IL 60016
Estimated Value: $132,172 - $157,000
1
Bed
1
Bath
21,822
Sq Ft
$6/Sq Ft
Est. Value
About This Home
This home is located at 8814 Briar Ct Unit 88142B, Des Plaines, IL 60016 and is currently estimated at $141,043, approximately $6 per square foot. 8814 Briar Ct Unit 88142B is a home located in Cook County with nearby schools including Apollo Elementary School, Gemini Middle School, and Maine East High School.
Ownership History
Date
Name
Owned For
Owner Type
Purchase Details
Closed on
Nov 14, 2022
Sold by
Bikneris Jerry and Bikneris Darinka
Bought by
Miteva Iva
Current Estimated Value
Purchase Details
Closed on
Dec 11, 2008
Sold by
Federal Deposit Insurance Corporation
Bought by
Jpmorgan Chase Bank National Association
Purchase Details
Closed on
Dec 10, 2008
Sold by
Jp Morgan Chase Bank National Associatio
Bought by
Bikneris Jerry and Bikneris Darinka
Purchase Details
Closed on
Mar 27, 2008
Sold by
Kawula Janusz
Bought by
Federal Home Loan Mortgage Corporation
Purchase Details
Closed on
Jul 19, 2004
Sold by
Parkway Bank & Trust Co
Bought by
Kawula Janusz
Home Financials for this Owner
Home Financials are based on the most recent Mortgage that was taken out on this home.
Original Mortgage
$124,200
Interest Rate
6.37%
Mortgage Type
Purchase Money Mortgage
Create a Home Valuation Report for This Property
The Home Valuation Report is an in-depth analysis detailing your home's value as well as a comparison with similar homes in the area
Home Values in the Area
Average Home Value in this Area
Purchase History
| Date | Buyer | Sale Price | Title Company |
|---|---|---|---|
| Miteva Iva | $103,000 | First American Title | |
| Jpmorgan Chase Bank National Association | -- | None Available | |
| Bikneris Jerry | $65,000 | Service Link | |
| Federal Home Loan Mortgage Corporation | -- | None Available | |
| Kawula Janusz | $138,000 | Pntn |
Source: Public Records
Mortgage History
| Date | Status | Borrower | Loan Amount |
|---|---|---|---|
| Previous Owner | Kawula Janusz | $127,000 | |
| Previous Owner | Kawula Janusz | $124,200 |
Source: Public Records
Tax History Compared to Growth
Tax History
| Year | Tax Paid | Tax Assessment Tax Assessment Total Assessment is a certain percentage of the fair market value that is determined by local assessors to be the total taxable value of land and additions on the property. | Land | Improvement |
|---|---|---|---|---|
| 2024 | $2,086 | $8,092 | $777 | $7,315 |
| 2023 | $2,086 | $8,092 | $777 | $7,315 |
| 2022 | $2,086 | $8,092 | $777 | $7,315 |
| 2021 | $2,493 | $7,940 | $1,195 | $6,745 |
| 2020 | $2,435 | $7,940 | $1,195 | $6,745 |
| 2019 | $2,397 | $8,885 | $1,195 | $7,690 |
| 2018 | $1,160 | $3,772 | $1,046 | $2,726 |
| 2017 | $1,144 | $3,772 | $1,046 | $2,726 |
| 2016 | $1,068 | $3,772 | $1,046 | $2,726 |
| 2015 | $1,244 | $4,026 | $896 | $3,130 |
| 2014 | $1,201 | $4,026 | $896 | $3,130 |
| 2013 | $1,181 | $4,026 | $896 | $3,130 |
Source: Public Records
Map
Nearby Homes
- 9332 Landings Ln Unit 205
- 8852 Robin Dr Unit E
- 9335 Landings Ln Unit 206
- 9335 Landings Ln Unit 202
- 9386 Landings Ln Unit 306
- 9375 Landings Ln Unit 405
- 9396 Landings Ln Unit 602
- 9396 Landings Ln Unit 304
- 9396 Landings Ln Unit 405
- 9235 W Ballard Rd Unit 101
- 489 Good Ave
- 9209 Bumble Bee Dr Unit 2G
- 2000 Parkside Dr Unit B2
- 9205 Potter Rd Unit 1C
- 2550 E Church St
- 9205 Bumble Bee Dr Unit 108H
- 1754 Park Ridge Point Unit 1
- 1456 Tyrell Ave Unit 2
- 8901 N Western Ave Unit A116
- 1607 Park Ridge Point
- 8814 Briar Ct Unit 1B
- 8814 Briar Ct Unit 88143B
- 8814 Briar Ct Unit 88142D
- 8814 Briar Ct Unit 88142C
- 8814 Briar Ct Unit 88143A
- 8814 Briar Ct Unit 88141B
- 8814 Briar Ct Unit 88141C
- 8814 Briar Ct Unit 88142B
- 8814 Briar Ct Unit 88141A
- 8814 Briar Ct Unit 88143D
- 8814 Briar Ct Unit 88143C
- 8814 Briar Ct Unit 88142A
- 8814 Briar Ct Unit 2D
- 8814 Briar Ct Unit 3B
- 8814 Briar Ct Unit 3A
- 8814 Briar Ct Unit 2C
- 8814 Briar Ct Unit 1C
- 8814 Briar Ct
- 8814 Briar Ct Unit 2C
- 8814 Briar Ct Unit 1A