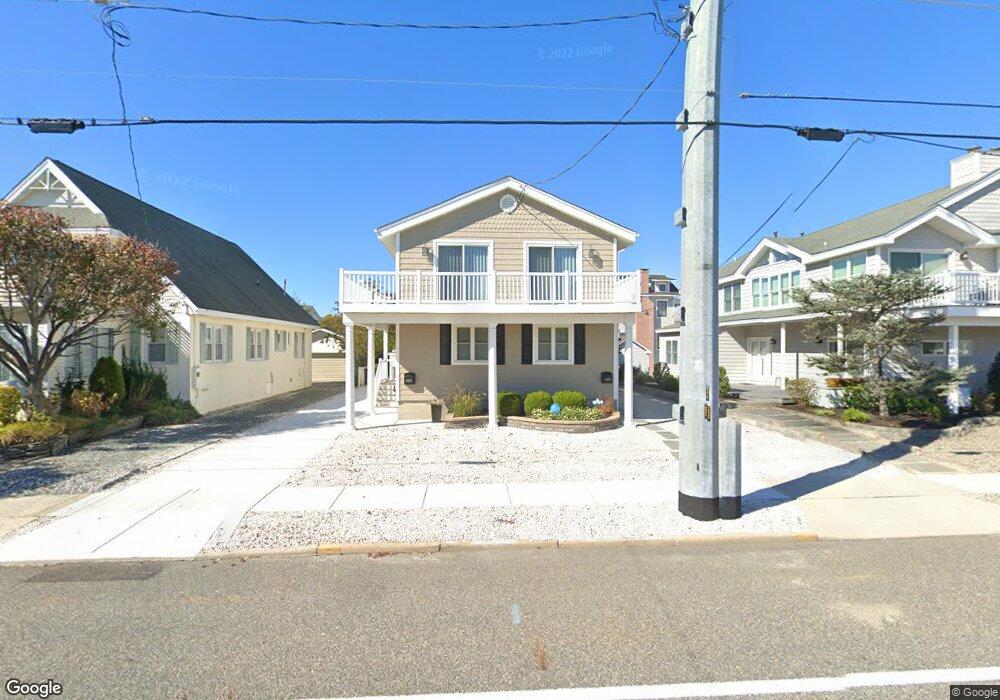
8815 2nd Ave Unit B Stone Harbor, NJ 08247
Estimated Value: $1,550,000 - $2,044,000
--
Bed
--
Bath
1,404
Sq Ft
$1,300/Sq Ft
Est. Value
About This Home
This home is located at 8815 2nd Ave Unit B, Stone Harbor, NJ 08247 and is currently estimated at $1,825,671, approximately $1,300 per square foot. 8815 2nd Ave Unit B is a home located in Cape May County with nearby schools including Stone Harbor Elementary School.
Ownership History
Date
Name
Owned For
Owner Type
Purchase Details
Closed on
Jul 23, 2018
Sold by
Davis Paul P
Bought by
Digiamberadino John A and Digiamberardino Diana F
Current Estimated Value
Home Financials for this Owner
Home Financials are based on the most recent Mortgage that was taken out on this home.
Original Mortgage
$620,000
Outstanding Balance
$538,511
Interest Rate
4.6%
Mortgage Type
Adjustable Rate Mortgage/ARM
Estimated Equity
$1,287,160
Purchase Details
Closed on
Aug 5, 2005
Sold by
Davis Paul Preston and Davis Mary F
Bought by
Davis Paul Preston
Create a Home Valuation Report for This Property
The Home Valuation Report is an in-depth analysis detailing your home's value as well as a comparison with similar homes in the area
Home Values in the Area
Average Home Value in this Area
Purchase History
| Date | Buyer | Sale Price | Title Company |
|---|---|---|---|
| Digiamberadino John A | $775,000 | -- | |
| Davis Paul Preston | -- | -- |
Source: Public Records
Mortgage History
| Date | Status | Borrower | Loan Amount |
|---|---|---|---|
| Open | Digiamberadino John A | $620,000 |
Source: Public Records
Tax History Compared to Growth
Tax History
| Year | Tax Paid | Tax Assessment Tax Assessment Total Assessment is a certain percentage of the fair market value that is determined by local assessors to be the total taxable value of land and additions on the property. | Land | Improvement |
|---|---|---|---|---|
| 2025 | $7,015 | $937,800 | $655,200 | $282,600 |
| 2024 | $7,015 | $937,800 | $655,200 | $282,600 |
| 2023 | $6,893 | $937,800 | $655,200 | $282,600 |
| 2022 | $6,490 | $937,800 | $655,200 | $282,600 |
| 2021 | $5,374 | $937,800 | $655,200 | $282,600 |
| 2020 | $5,721 | $937,800 | $655,200 | $282,600 |
| 2019 | $5,374 | $937,800 | $655,200 | $282,600 |
| 2018 | $5,177 | $937,800 | $655,200 | $282,600 |
| 2017 | $5,159 | $929,500 | $780,000 | $149,500 |
| 2016 | $4,973 | $929,500 | $780,000 | $149,500 |
| 2015 | $4,880 | $929,500 | $780,000 | $149,500 |
| 2014 | $4,815 | $929,500 | $780,000 | $149,500 |
Source: Public Records
Map
Nearby Homes
- 252 89th St Unit NORTH
- 215 89th St
- 144 89th St
- 243 87th St
- 294 88th St
- 225 85th St
- 294 86th St
- 288 86th St
- 9214 2nd Ave
- 164 93rd St
- 10 92nd St Unit A
- 164 84th St
- 260 83rd St Unit 1
- 8314 Sunset Dr
- 146 83rd St Unit 1
- 13 93rd St Unit 5
- 8310 Sunset Dr
- 8306 Sunset Dr Unit 8306
- 318 83rd St Unit 9
- 370 83rd St Unit East