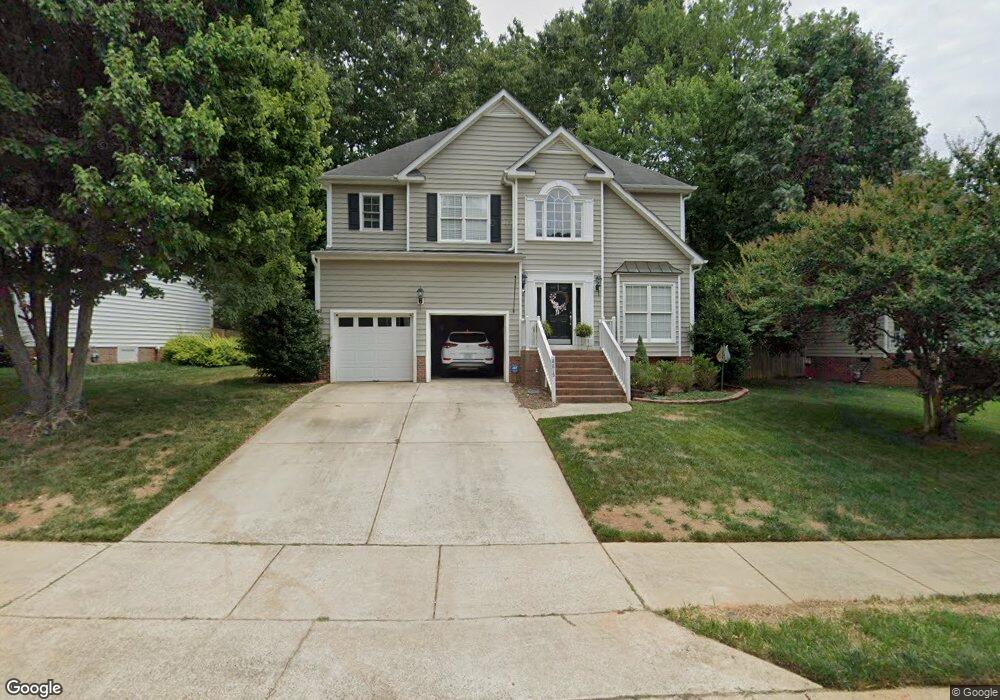
8815 Erinsbrook Dr Raleigh, NC 27617
Umstead NeighborhoodEstimated Value: $504,816 - $521,000
3
Beds
3
Baths
2,244
Sq Ft
$228/Sq Ft
Est. Value
About This Home
This home is located at 8815 Erinsbrook Dr, Raleigh, NC 27617 and is currently estimated at $511,954, approximately $228 per square foot. 8815 Erinsbrook Dr is a home located in Wake County with nearby schools including Sycamore Creek Elementary School, Pine Hollow Middle School, and Leesville Road High School.
Ownership History
Date
Name
Owned For
Owner Type
Purchase Details
Closed on
May 24, 2013
Sold by
Moye Brandon James and Moye Erin Riley
Bought by
Bridges Steven L and Bridges Stephanie D
Current Estimated Value
Home Financials for this Owner
Home Financials are based on the most recent Mortgage that was taken out on this home.
Original Mortgage
$229,900
Outstanding Balance
$162,616
Interest Rate
3.44%
Mortgage Type
New Conventional
Estimated Equity
$349,338
Purchase Details
Closed on
Jul 16, 2003
Sold by
Scott Timothy E and Scott Latanya
Bought by
Lloyd Christopher R and Lloyd Michelle
Home Financials for this Owner
Home Financials are based on the most recent Mortgage that was taken out on this home.
Original Mortgage
$189,905
Interest Rate
5.2%
Mortgage Type
Purchase Money Mortgage
Purchase Details
Closed on
Aug 31, 2000
Sold by
St Lawrence Homes Inc
Bought by
Scott Timothy E and Scott Latanya B
Home Financials for this Owner
Home Financials are based on the most recent Mortgage that was taken out on this home.
Original Mortgage
$177,300
Interest Rate
8%
Create a Home Valuation Report for This Property
The Home Valuation Report is an in-depth analysis detailing your home's value as well as a comparison with similar homes in the area
Home Values in the Area
Average Home Value in this Area
Purchase History
| Date | Buyer | Sale Price | Title Company |
|---|---|---|---|
| Bridges Steven L | $242,000 | None Available | |
| Lloyd Christopher R | $200,000 | -- | |
| Scott Timothy E | $197,000 | -- |
Source: Public Records
Mortgage History
| Date | Status | Borrower | Loan Amount |
|---|---|---|---|
| Open | Bridges Steven L | $229,900 | |
| Previous Owner | Lloyd Christopher R | $189,905 | |
| Previous Owner | Scott Timothy E | $177,300 |
Source: Public Records
Tax History Compared to Growth
Tax History
| Year | Tax Paid | Tax Assessment Tax Assessment Total Assessment is a certain percentage of the fair market value that is determined by local assessors to be the total taxable value of land and additions on the property. | Land | Improvement |
|---|---|---|---|---|
| 2025 | $4,211 | $480,574 | $140,000 | $340,574 |
| 2024 | $4,194 | $480,574 | $140,000 | $340,574 |
| 2023 | $3,522 | $321,275 | $95,000 | $226,275 |
| 2022 | $3,273 | $321,275 | $95,000 | $226,275 |
| 2021 | $3,146 | $321,275 | $95,000 | $226,275 |
| 2020 | $3,089 | $321,275 | $95,000 | $226,275 |
| 2019 | $3,206 | $274,933 | $95,000 | $179,933 |
| 2018 | $3,024 | $274,933 | $95,000 | $179,933 |
| 2017 | $2,880 | $274,933 | $95,000 | $179,933 |
| 2016 | $2,821 | $274,933 | $95,000 | $179,933 |
| 2015 | $2,604 | $249,583 | $68,000 | $181,583 |
| 2014 | -- | $249,583 | $68,000 | $181,583 |
Source: Public Records
Map
Nearby Homes
- 7036 Englehardt Dr
- 7104 Fugate Ct
- 7100 Fugate Ct
- 8721 Little Deer Ln
- 6920 Lamarsh Ct
- 9116 Erinsbrook Dr
- 12018 Mcbride Dr
- 9604 Miranda Dr
- 7403 Leesville Rd
- 9808 Goodrum Ct
- 6516 Englehardt Dr
- 5233 Fairmead Cir
- 10119 2nd Star Ct
- 10132 Marleybone Dr
- 5024 Dawn Piper Dr
- 5008 Dawn Piper Dr
- 7229 Terregles Dr
- 7328 Caversham Way
- 9413 Bells Valley Dr
- 10141 Bessborough Dr
- 8809 Erinsbrook Dr
- 8901 Erinsbrook Dr
- 8805 Narron Ct
- 8801 Narron Ct
- 8805 Erinsbrook Dr
- 8905 Erinsbrook Dr
- 8809 Narron Ct
- 8816 Erinsbrook Dr
- 8812 Erinsbrook Dr
- 8820 Erinsbrook Dr
- 8900 Erinsbrook Dr
- 8808 Erinsbrook Dr
- 8909 Erinsbrook Dr
- 8800 Narron Ct
- 8904 Erinsbrook Dr
- 7109 Englehardt Dr
- 7105 Englehardt Dr
- 8804 Erinsbrook Dr
- 8908 Erinsbrook Dr
- 7101 Englehardt Dr