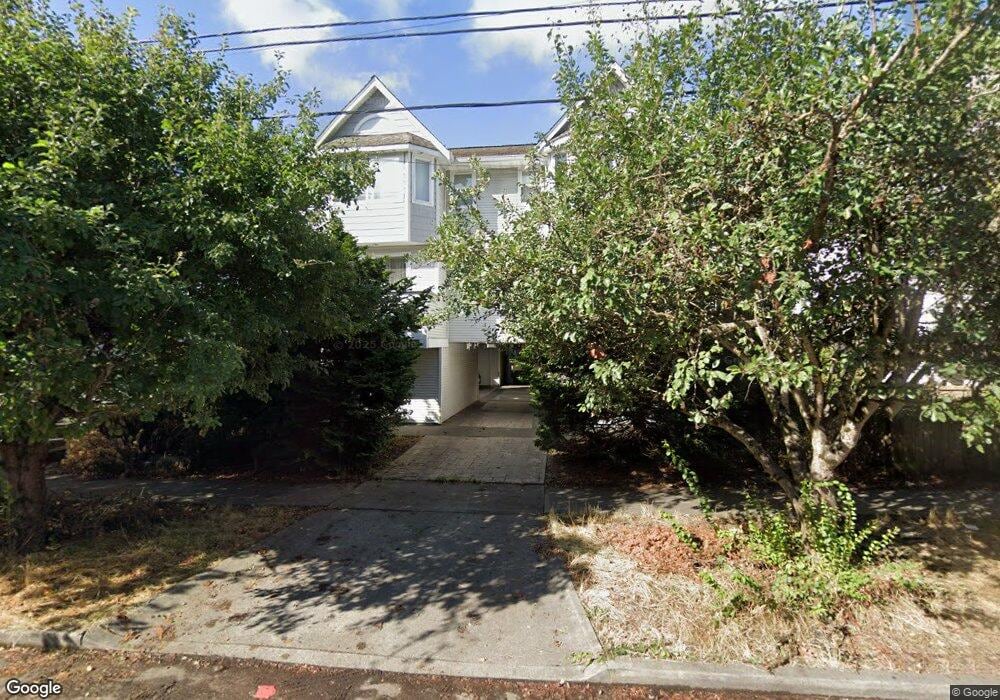
8815 Stone Ave N Unit 4 Seattle, WA 98103
North College Park Neighborhood
4
Beds
6
Baths
4,356
Sq Ft
5,140
Sq Ft Lot
About This Home
This home is located at 8815 Stone Ave N Unit 4, Seattle, WA 98103. 8815 Stone Ave N Unit 4 is a home located in King County with nearby schools including Daniel Bagley Elementary School, Robert Eagle Staff Middle School, and Ingraham High School.
Ownership History
Date
Name
Owned For
Owner Type
Purchase Details
Closed on
Nov 10, 2020
Sold by
Mirchandani Vivan and Mirchandani Rachna Sarin
Bought by
Mirchandani Vivan and Mirchandani Rachna Sarin
Home Financials for this Owner
Home Financials are based on the most recent Mortgage that was taken out on this home.
Original Mortgage
$885,000
Outstanding Balance
$791,997
Interest Rate
3.12%
Mortgage Type
New Conventional
Purchase Details
Closed on
Dec 17, 2018
Sold by
Mirchandani Vivan and Mirchandani Rachna Sarin
Bought by
Mirchandani Rachna Sarin and Mirchandani Vivan
Purchase Details
Closed on
Mar 10, 2017
Sold by
The Tri Stone Llc
Bought by
Mirchandani Vivan and Mirchandani Rachna Sarin
Home Financials for this Owner
Home Financials are based on the most recent Mortgage that was taken out on this home.
Original Mortgage
$1,000,000
Interest Rate
4.19%
Purchase Details
Closed on
Dec 22, 2000
Sold by
Odgers Sidney J
Bought by
The Tri & Stone Llc
Purchase Details
Closed on
Oct 5, 2000
Sold by
Odgers John W and Odgers Rosalyn
Bought by
Odgers Cynthia M
Create a Home Valuation Report for This Property
The Home Valuation Report is an in-depth analysis detailing your home's value as well as a comparison with similar homes in the area
Home Values in the Area
Average Home Value in this Area
Purchase History
| Date | Buyer | Sale Price | Title Company |
|---|---|---|---|
| Mirchandani Vivan | -- | None Available | |
| Mirchandani Rachna Sarin | -- | None Available | |
| Mirchandani Vivan | $1,459,600 | Fidelity | |
| The Tri & Stone Llc | -- | -- | |
| The Tri & Stone Llc | -- | -- | |
| The Tri & Stone Llc | -- | -- | |
| Odgers Cynthia M | -- | -- | |
| Odgers Brian N | -- | -- | |
| Odgers Sidney J | -- | -- | |
| Odgers Sidney J | -- | -- |
Source: Public Records
Mortgage History
| Date | Status | Borrower | Loan Amount |
|---|---|---|---|
| Open | Mirchandani Vivan | $885,000 | |
| Previous Owner | Mirchandani Vivan | $1,000,000 |
Source: Public Records
Tax History Compared to Growth
Tax History
| Year | Tax Paid | Tax Assessment Tax Assessment Total Assessment is a certain percentage of the fair market value that is determined by local assessors to be the total taxable value of land and additions on the property. | Land | Improvement |
|---|---|---|---|---|
| 2024 | $12,561 | $1,262,000 | $922,500 | $339,500 |
| 2023 | $13,225 | $1,414,000 | $922,500 | $491,500 |
| 2022 | $13,779 | $1,527,000 | $922,500 | $604,500 |
| 2021 | $14,753 | $1,472,000 | $922,500 | $549,500 |
| 2020 | $14,091 | $1,506,000 | $871,200 | $634,800 |
| 2018 | $12,915 | $1,375,000 | $717,500 | $657,500 |
| 2017 | $11,700 | $1,289,000 | $563,700 | $725,300 |
| 2016 | $9,627 | $1,207,000 | $410,000 | $797,000 |
| 2015 | -- | $963,000 | $384,300 | $578,700 |
| 2014 | -- | $877,000 | $358,700 | $518,300 |
| 2013 | -- | $835,000 | $358,700 | $476,300 |
Source: Public Records
Map
Nearby Homes
- 8829 Midvale Ave N
- 1201 N 88th St
- 8830 Nesbit Ave N
- 8553 Midvale Ave N Unit C
- 8853 Stone Ave N
- 8811 Interlake Ave N Unit A
- 8849 Nesbit Ave N
- 8530 Nesbit Ave N
- 1134 N 90th St Unit D
- 8848 Interlake Ave N
- 8523 Midvale Ave N Unit A
- 8823 Ashworth Ave N
- 8854 Interlake Ave N
- 8543 Ashworth Ave N
- 939 N 88th St
- 1128 N 91st St
- 1315 N 85th St
- 1140 N 92nd St
- 1125 N 93rd St Unit 6
- 8825 Wallingford Ave N
- 8815 Stone Ave N
- 8821 Stone Ave N Unit B
- 8821 Stone Ave N Unit D
- 8821 Stone Ave N Unit C
- 8821 Stone Ave N Unit A
- 8821 Stone Ave N
- 8811 Stone Ave N Unit B
- 8811 Stone Ave N
- 8821 Stone Ave N
- 1216 N 88th St
- 8825 Stone Ave N Unit B
- 8825 Stone Ave N Unit A
- 8825 Stone Ave N Unit C
- 1218 N 88th St
- 1214 N 88th St
- 1220 N 88th St
- 8818 Midvale Ave N
- 8814 Midvale Ave N
- 8814 Midvale Ave N Unit A
- 8814 Midvale Ave N Unit D