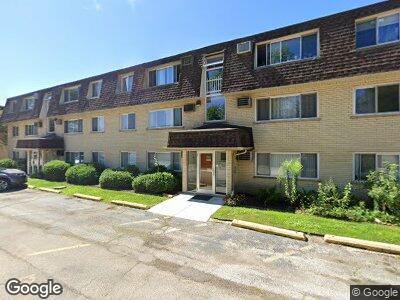
8816 Briar Ct Unit 88163D Des Plaines, IL 60016
Estimated Value: $143,792 - $172,000
1
Bed
--
Bath
21,822
Sq Ft
$7/Sq Ft
Est. Value
About This Home
This home is located at 8816 Briar Ct Unit 88163D, Des Plaines, IL 60016 and is currently estimated at $154,948, approximately $7 per square foot. 8816 Briar Ct Unit 88163D is a home located in Cook County with nearby schools including Apollo Elementary School, Gemini Middle School, and Maine East High School.
Ownership History
Date
Name
Owned For
Owner Type
Purchase Details
Closed on
Apr 16, 2021
Sold by
Sebo Leokadia
Bought by
Sebo Leokadia and Leokadia Sebo Declaration Of T
Current Estimated Value
Purchase Details
Closed on
Sep 15, 2015
Sold by
Frys Aneliya
Bought by
Sebo Leokadia
Purchase Details
Closed on
Aug 7, 2014
Sold by
Kothari Vijaykant N and Kothari Ashaben
Bought by
Frys Aneliya
Purchase Details
Closed on
Jan 10, 2014
Sold by
Capital One Na
Bought by
Kothari Vijaykant N
Purchase Details
Closed on
Dec 27, 2012
Sold by
Gajewska Dominika
Bought by
Ing Bank Fsb
Purchase Details
Closed on
Mar 30, 2004
Sold by
Parkway Bank & Trust Co
Bought by
Gajewska Dominika
Home Financials for this Owner
Home Financials are based on the most recent Mortgage that was taken out on this home.
Original Mortgage
$110,000
Interest Rate
3.82%
Mortgage Type
Adjustable Rate Mortgage/ARM
Create a Home Valuation Report for This Property
The Home Valuation Report is an in-depth analysis detailing your home's value as well as a comparison with similar homes in the area
Home Values in the Area
Average Home Value in this Area
Purchase History
| Date | Buyer | Sale Price | Title Company |
|---|---|---|---|
| Sebo Leokadia | -- | None Available | |
| Sebo Leokadia | $78,000 | Attorney | |
| Frys Aneliya | $52,000 | Saturn Title Llc | |
| Kothari Vijaykant N | $45,500 | First American Title | |
| Ing Bank Fsb | -- | None Available | |
| Gajewska Dominika | $137,500 | Pntn |
Source: Public Records
Mortgage History
| Date | Status | Borrower | Loan Amount |
|---|---|---|---|
| Previous Owner | Gajewska Dominika | $126,000 | |
| Previous Owner | Gajewska Dominika | $110,000 |
Source: Public Records
Tax History Compared to Growth
Tax History
| Year | Tax Paid | Tax Assessment Tax Assessment Total Assessment is a certain percentage of the fair market value that is determined by local assessors to be the total taxable value of land and additions on the property. | Land | Improvement |
|---|---|---|---|---|
| 2024 | $1,349 | $8,653 | $831 | $7,822 |
| 2023 | $1,349 | $8,653 | $831 | $7,822 |
| 2022 | $1,349 | $8,653 | $831 | $7,822 |
| 2021 | $1,621 | $8,491 | $1,278 | $7,213 |
| 2020 | $1,653 | $8,491 | $1,278 | $7,213 |
| 2019 | $1,638 | $9,501 | $1,278 | $8,223 |
| 2018 | $184 | $4,033 | $1,118 | $2,915 |
| 2017 | $200 | $4,033 | $1,118 | $2,915 |
| 2016 | $435 | $4,033 | $1,118 | $2,915 |
| 2015 | $1,331 | $4,305 | $958 | $3,347 |
| 2014 | $518 | $4,305 | $958 | $3,347 |
| 2013 | $492 | $4,305 | $958 | $3,347 |
Source: Public Records
Map
Nearby Homes
- 9332 Landings Ln Unit 205
- 8852 Robin Dr Unit E
- 9335 Landings Ln Unit 206
- 9335 Landings Ln Unit 202
- 9386 Landings Ln Unit 306
- 9375 Landings Ln Unit 405
- 9396 Landings Ln Unit 304
- 9396 Landings Ln Unit 405
- 9235 W Ballard Rd Unit 101
- 489 Good Ave
- 9209 Bumble Bee Dr Unit 2G
- 2000 Parkside Dr Unit B2
- 9205 Potter Rd Unit 1C
- 2550 E Church St
- 9205 Bumble Bee Dr Unit 108H
- 1754 Park Ridge Point Unit 1
- 1456 Tyrell Ave Unit 2
- 8901 N Western Ave Unit A116
- 1607 Park Ridge Point
- 8955 Lyons St
- 8816 Briar Ct Unit 88163C
- 8816 Briar Ct Unit 88162C
- 8816 Briar Ct Unit 88161B
- 8816 Briar Ct Unit 88161A
- 8816 Briar Ct Unit 88163B
- 8816 Briar Ct Unit 88162D
- 8816 Briar Ct Unit 88161C
- 8816 Briar Ct Unit 88163D
- 8816 Briar Ct Unit 88163A
- 8816 Briar Ct Unit 88162A
- 8816 Briar Ct Unit 88162B
- 8816 Briar Ct Unit 3A
- 8816 Briar Ct Unit 3D
- 8816 Briar Ct Unit 3C
- 8816 Briar Ct Unit 3B
- 8816 Briar Ct Unit 2C
- 8816 Briar Ct Unit 2A
- 8816 Briar Ct Unit 2D
- 8814 Briar Ct Unit 1B
- 8814 Briar Ct Unit 88143B