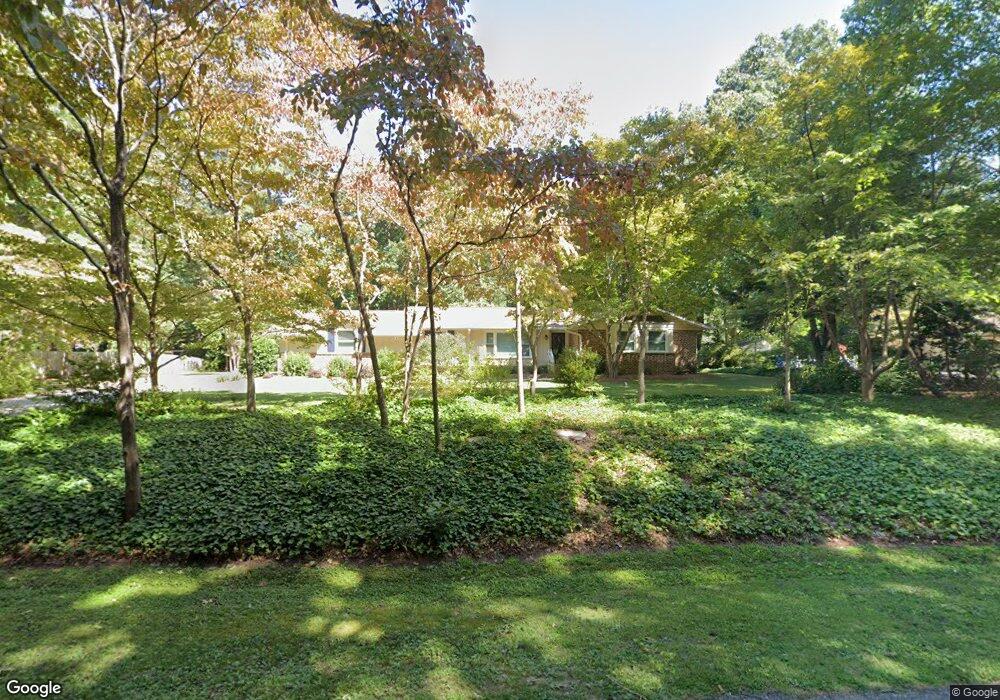
8816 Carters Cove Rd Suffolk, VA 23433
Chuckatuck NeighborhoodEstimated Value: $423,000 - $501,000
3
Beds
2
Baths
1,723
Sq Ft
$264/Sq Ft
Est. Value
About This Home
This home is located at 8816 Carters Cove Rd, Suffolk, VA 23433 and is currently estimated at $454,153, approximately $263 per square foot. 8816 Carters Cove Rd is a home located in Suffolk City with nearby schools including Oakland Elementary School, King's Fork Middle School, and King's Fork High School.
Ownership History
Date
Name
Owned For
Owner Type
Purchase Details
Closed on
Nov 9, 2020
Sold by
Lovingood D Brian D and Lovingood Kristin B
Bought by
Vanstraten Michael Glen and Vanstraten Van Straten
Current Estimated Value
Home Financials for this Owner
Home Financials are based on the most recent Mortgage that was taken out on this home.
Original Mortgage
$139,000
Outstanding Balance
$122,841
Interest Rate
2.8%
Mortgage Type
New Conventional
Estimated Equity
$331,312
Purchase Details
Closed on
Mar 30, 2011
Sold by
Masters Cheryl
Bought by
Lovingood D Brian
Home Financials for this Owner
Home Financials are based on the most recent Mortgage that was taken out on this home.
Original Mortgage
$221,000
Interest Rate
5.04%
Mortgage Type
New Conventional
Create a Home Valuation Report for This Property
The Home Valuation Report is an in-depth analysis detailing your home's value as well as a comparison with similar homes in the area
Home Values in the Area
Average Home Value in this Area
Purchase History
| Date | Buyer | Sale Price | Title Company |
|---|---|---|---|
| Vanstraten Michael Glen | $290,000 | Fidelity National Title Co | |
| Lovingood D Brian | $250,000 | -- |
Source: Public Records
Mortgage History
| Date | Status | Borrower | Loan Amount |
|---|---|---|---|
| Open | Vanstraten Michael Glen | $139,000 | |
| Previous Owner | Lovingood D Brian | $221,000 |
Source: Public Records
Tax History
| Year | Tax Paid | Tax Assessment Tax Assessment Total Assessment is a certain percentage of the fair market value that is determined by local assessors to be the total taxable value of land and additions on the property. | Land | Improvement |
|---|---|---|---|---|
| 2025 | $4,613 | $389,100 | $79,500 | $309,600 |
| 2024 | $4,613 | $371,000 | $79,500 | $291,500 |
| 2023 | $4,363 | $358,800 | $79,500 | $279,300 |
| 2022 | $3,464 | $317,800 | $79,500 | $238,300 |
| 2021 | $3,200 | $288,300 | $66,300 | $222,000 |
| 2020 | $3,064 | $276,000 | $66,300 | $209,700 |
| 2019 | $2,804 | $252,600 | $66,300 | $186,300 |
| 2018 | $2,841 | $252,100 | $66,300 | $185,800 |
| 2017 | $2,614 | $244,300 | $66,300 | $178,000 |
| 2016 | $2,614 | $244,300 | $66,300 | $178,000 |
| 2015 | $1,287 | $244,300 | $66,300 | $178,000 |
| 2014 | $1,287 | $244,300 | $66,300 | $178,000 |
Source: Public Records
Map
Nearby Homes
- 8957 River Crescent
- 1917 Governors Pointe Dr
- 2029 Fairway Dr
- 9138 Eclipse Dr
- 321 Tindalls Ct
- 325 Tindall's Ct
- 14 River Edge Dr
- 230 Wentworth Ct
- 8369 Crittenden Rd
- 44 River Edge Dr
- 40 River Edge Dr
- 24233 Bush Creek Cir
- 9325 Rivershore Dr
- 9327 Rivershore Dr
- 23496 Owen Farm Rd
- 6 Merritt Cove
- 9100 Cedar Crest Ln
- 1802 Oyster Bay Ln
- 1840 Oyster Bay Ln
- 1804 Cherry Grove Rd N
- 8820 Carters Cove Rd
- 8812 Carters Cove Rd
- 8821 Carters Cove Rd
- 8808 Carters Cove Rd
- 8813 Carters Cove Rd
- 1609 Bridge Rd
- 1504 W Arbor Arch
- 8807 Carters Cove Rd
- 8825 Carters Cove Rd
- 1672 Tautog Rd
- 1607 Bridge Rd
- 8804 Carters Cove Rd
- MM Kellan at Cornus Ct
- 8832 Adams Dr E
- 8841 Adams Dr E
- 8805 Carters Cove Rd
- 1605 Bridge Rd
- 8829 Carters Cove Rd
- 1505 W Arbor Arch
- 8828 Adams Dr E
Your Personal Tour Guide
Ask me questions while you tour the home.