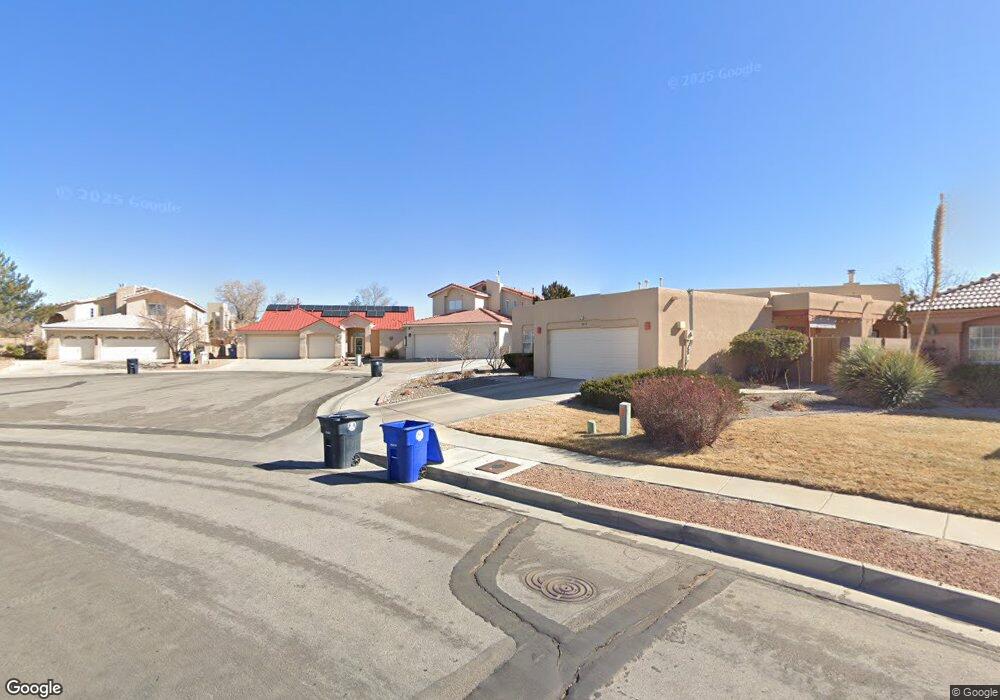
8816 Ryan Patrick Dr NW Albuquerque, NM 87114
Piedras Marcadas NeighborhoodEstimated Value: $405,000 - $471,000
4
Beds
3
Baths
2,158
Sq Ft
$202/Sq Ft
Est. Value
About This Home
This home is located at 8816 Ryan Patrick Dr NW, Albuquerque, NM 87114 and is currently estimated at $435,354, approximately $201 per square foot. 8816 Ryan Patrick Dr NW is a home located in Bernalillo County with nearby schools including Petroglyph Elementary School, James Monroe Middle School, and Cibola High School.
Ownership History
Date
Name
Owned For
Owner Type
Purchase Details
Closed on
Jan 18, 2002
Sold by
Alvarado Vince
Bought by
Olguin Yolanda
Current Estimated Value
Home Financials for this Owner
Home Financials are based on the most recent Mortgage that was taken out on this home.
Original Mortgage
$140,000
Outstanding Balance
$56,732
Interest Rate
7.07%
Estimated Equity
$378,622
Purchase Details
Closed on
Jun 18, 2001
Sold by
Rathwick Alan and Rathwick Annette Roberts
Bought by
Olguin Yolanda and Alvarado Vince
Purchase Details
Closed on
Nov 4, 1998
Sold by
Shell Blayne and Shell Sara A
Bought by
Rathwick Alan and Roberts Rathwick Annette
Home Financials for this Owner
Home Financials are based on the most recent Mortgage that was taken out on this home.
Original Mortgage
$141,200
Interest Rate
9.25%
Purchase Details
Closed on
Mar 27, 1998
Sold by
Raylee Homes Inc
Bought by
Shell Blayne and Shell Sara
Create a Home Valuation Report for This Property
The Home Valuation Report is an in-depth analysis detailing your home's value as well as a comparison with similar homes in the area
Home Values in the Area
Average Home Value in this Area
Purchase History
| Date | Buyer | Sale Price | Title Company |
|---|---|---|---|
| Olguin Yolanda | -- | Fidelity National Title Co | |
| Olguin Yolanda | -- | -- | |
| Rathwick Alan | -- | -- | |
| Shell Blayne | -- | -- |
Source: Public Records
Mortgage History
| Date | Status | Borrower | Loan Amount |
|---|---|---|---|
| Open | Olguin Yolanda | $140,000 | |
| Previous Owner | Rathwick Alan | $141,200 | |
| Closed | Olguin Yolanda | $26,250 |
Source: Public Records
Tax History Compared to Growth
Tax History
| Year | Tax Paid | Tax Assessment Tax Assessment Total Assessment is a certain percentage of the fair market value that is determined by local assessors to be the total taxable value of land and additions on the property. | Land | Improvement |
|---|---|---|---|---|
| 2025 | $3,570 | $89,223 | $23,111 | $66,112 |
| 2024 | $3,570 | $86,625 | $22,438 | $64,187 |
| 2023 | $3,508 | $84,102 | $21,785 | $62,317 |
| 2022 | $3,388 | $81,654 | $21,151 | $60,503 |
| 2021 | $3,272 | $79,275 | $20,535 | $58,740 |
| 2020 | $3,216 | $76,967 | $19,937 | $57,030 |
| 2019 | $3,119 | $74,725 | $19,356 | $55,369 |
| 2018 | $3,005 | $74,725 | $19,356 | $55,369 |
| 2017 | $2,910 | $72,549 | $18,793 | $53,756 |
| 2016 | $2,909 | $68,385 | $17,714 | $50,671 |
| 2015 | $66,393 | $66,393 | $17,198 | $49,195 |
| 2014 | $2,819 | $66,393 | $17,198 | $49,195 |
| 2013 | -- | $66,926 | $17,198 | $49,728 |
Source: Public Records
Map
Nearby Homes
- 9232 Jill Patricia St NW
- 9323 Seneca Dr NW
- 8416 Calle Primera NW
- Catalina Plan at Estates at Academy
- 4320 La Paloma Rd NW
- 8416 Rancho Colina NW
- 9669 Asbury Ln NW
- 4916 T B Catron Ave NW
- 4600 Arlington Ave NW
- 4515 Millwood Ct NW
- 4512 Waynesboro Rd NW
- 8100 Rancho Viejo Ct NW
- 4309 Rancho Largo Rd NW
- 9838 Academy St NW
- 8204 Rancho Paraiso NW
- 4820 Summersville Dr NW
- 4600 Waynesboro Place NW
- 7824 Snowberry St NW
- 3920 Rancho Centro NW
- 7816 Bursera Dr NW
- 8812 Ryan Patrick Dr NW
- 4701 Sherry Ann Rd NW
- 8808 Ryan Patrick Dr NW
- 4705 Sherry Ann Rd NW
- 4709 Sherry Ann Rd NW
- 8804 Ryan Patrick Dr NW
- 8735 Springhill Dr NW
- 8739 Springhill Dr NW
- 4801 Sherry Ann Rd NW
- 8743 Springhill Dr NW
- 4800 Sherry Ann Rd NW
- 8800 Ryan Patrick Dr NW
- 8731 Springhill Dr NW
- 8747 Springhill Dr NW
- 4805 Sherry Ann Rd NW
- 4804 Sherry Ann Rd NW
- 8744 Westridge Place NW
- 8727 Springhill Dr NW
- 4801 Shelly Rose Rd NW
- 4809 Sherry Ann Rd NW