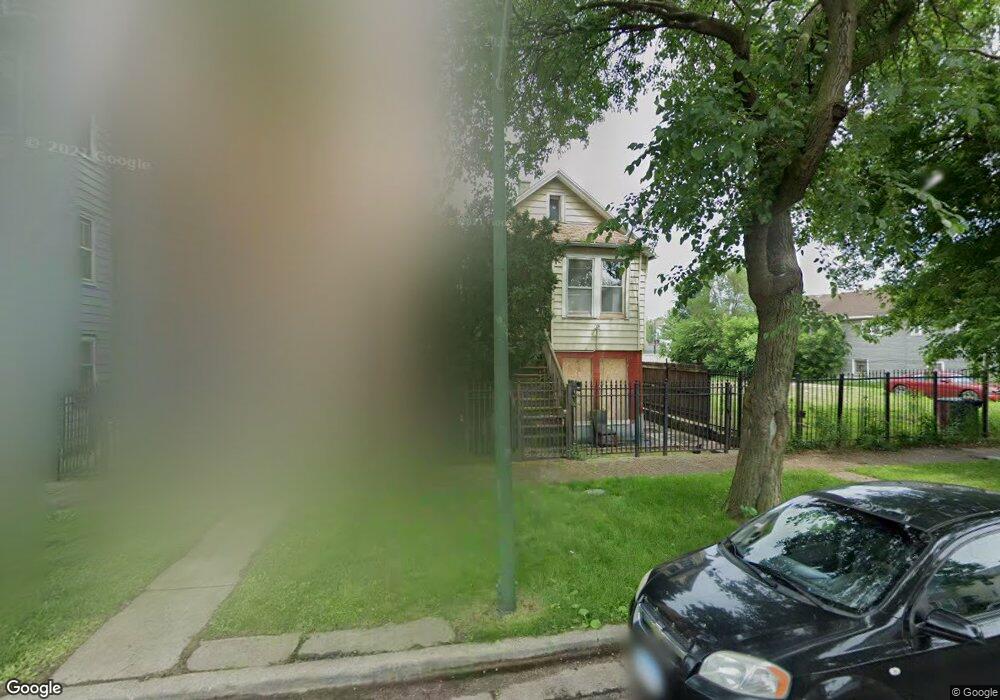
8817 S Exchange Ave Unit 1 Chicago, IL 60617
South Chicago NeighborhoodEstimated Value: $147,311 - $214,000
--
Bed
6
Baths
3,150
Sq Ft
$57/Sq Ft
Est. Value
About This Home
This home is located at 8817 S Exchange Ave Unit 1, Chicago, IL 60617 and is currently estimated at $180,656, approximately $57 per square foot. 8817 S Exchange Ave Unit 1 is a home located in Cook County with nearby schools including Arnold Mireles Academy, Noble - Baker College Preparatory High School, and Immaculate Conception School - Exchange.
Ownership History
Date
Name
Owned For
Owner Type
Purchase Details
Closed on
Nov 6, 2006
Sold by
Escobar Ninfa
Bought by
Escobar Ninfa and Arevalo Ana
Current Estimated Value
Purchase Details
Closed on
Mar 22, 2005
Sold by
Lopez Oscar
Bought by
Escobar Ninfa
Home Financials for this Owner
Home Financials are based on the most recent Mortgage that was taken out on this home.
Original Mortgage
$84,000
Interest Rate
5.64%
Mortgage Type
Commercial
Purchase Details
Closed on
Jun 22, 2000
Sold by
Garza Joel J and Garza Esther E
Bought by
Lopez Oscar
Home Financials for this Owner
Home Financials are based on the most recent Mortgage that was taken out on this home.
Original Mortgage
$75,260
Interest Rate
8.64%
Mortgage Type
Commercial
Create a Home Valuation Report for This Property
The Home Valuation Report is an in-depth analysis detailing your home's value as well as a comparison with similar homes in the area
Home Values in the Area
Average Home Value in this Area
Purchase History
| Date | Buyer | Sale Price | Title Company |
|---|---|---|---|
| Escobar Ninfa | -- | None Available | |
| Escobar Ninfa | $105,000 | Ticor Title | |
| Lopez Oscar | $70,000 | -- |
Source: Public Records
Mortgage History
| Date | Status | Borrower | Loan Amount |
|---|---|---|---|
| Closed | Escobar Ninfa | $84,000 | |
| Previous Owner | Lopez Oscar | $75,260 | |
| Closed | Lopez Oscar | $15,721 | |
| Closed | Escobar Ninfa | $21,000 |
Source: Public Records
Tax History Compared to Growth
Tax History
| Year | Tax Paid | Tax Assessment Tax Assessment Total Assessment is a certain percentage of the fair market value that is determined by local assessors to be the total taxable value of land and additions on the property. | Land | Improvement |
|---|---|---|---|---|
| 2024 | $735 | $2,606 | $2,606 | -- |
| 2023 | $717 | $3,475 | $3,475 | -- |
| 2022 | $717 | $3,475 | $3,475 | $0 |
| 2021 | $701 | $3,475 | $3,475 | $0 |
| 2020 | $776 | $3,475 | $3,475 | $0 |
| 2019 | $700 | $3,475 | $3,475 | $0 |
| 2018 | $688 | $3,475 | $3,475 | $0 |
| 2017 | $675 | $3,127 | $3,127 | $0 |
| 2016 | $628 | $3,127 | $3,127 | $0 |
| 2015 | $3,481 | $18,948 | $3,127 | $15,821 |
| 2014 | $3,464 | $18,623 | $2,432 | $16,191 |
| 2013 | $3,395 | $18,623 | $2,432 | $16,191 |
Source: Public Records
Map
Nearby Homes
- 8825 S Exchange Ave
- 8822 S Exchange Ave
- 8834 S Exchange Ave
- 8830 S Exchange Ave
- 8750 S Exchange Ave
- 8900 S Escanaba Ave
- 8711 S Exchange Ave
- 8909 S Houston Ave
- 2841 E 89th St
- 8937 S Houston Ave
- 2900 E 87th St
- 9021 S Exchange Ave
- 8942 S Baltimore Ave
- 9034 S Commercial Ave
- 9036 S Houston Ave
- 8639 S Burnham Ave
- 8613 S Houston Ave
- 8610 S Baltimore Ave
- 8601 S Houston Ave
- 8548 S Exchange Ave
- 8819 S Exchange Ave
- 8821 S Exchange Ave
- 8815 S Exchange Ave
- 8809 S Exchange Ave
- 8827 S Exchange Ave
- 8829 S Exchange Ave Unit 2
- 8833 S Exchange Ave
- 8801 S Exchange Ave
- 8812 S Commercial Ave
- 8820 S Commercial Ave
- 8835 S Exchange Ave
- 8812 S Exchange Ave
- 8818 S Exchange Ave Unit 1
- 8822 S Exchange Ave
- 8837 S Exchange Ave
- 8837 S Exchange Ave
- 8810 S Commercial Ave
- 8802 S Commercial Ave
- 8804 S Commercial Ave
- 8828 S Exchange Ave Unit 1REAR