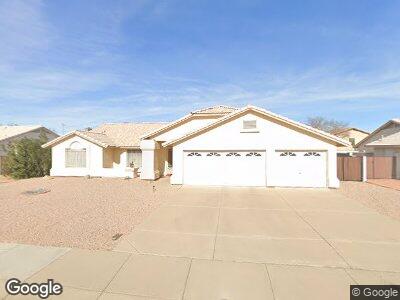
8818 W Charter Oak Rd Peoria, AZ 85381
Estimated Value: $414,703 - $473,000
--
Bed
3
Baths
1,839
Sq Ft
$244/Sq Ft
Est. Value
About This Home
This home is located at 8818 W Charter Oak Rd, Peoria, AZ 85381 and is currently estimated at $447,926, approximately $243 per square foot. 8818 W Charter Oak Rd is a home located in Maricopa County with nearby schools including Sky View Elementary School and Peoria High School.
Ownership History
Date
Name
Owned For
Owner Type
Purchase Details
Closed on
Aug 4, 2010
Sold by
Creenshaw George V and Crenshaw Gloria I
Bought by
Crenshaw George Vogel and Crenshaw Gloria Ideada
Current Estimated Value
Purchase Details
Closed on
Nov 17, 2000
Sold by
Crenshaw George V and Crenshaw Gloria I
Bought by
Crenshaw George and Crenshaw Gloria I
Purchase Details
Closed on
Dec 29, 1994
Sold by
Regal Homes Inc
Bought by
Crenshaw George and Crenshaw Gloria I
Home Financials for this Owner
Home Financials are based on the most recent Mortgage that was taken out on this home.
Original Mortgage
$108,700
Outstanding Balance
$1,760
Interest Rate
9.2%
Mortgage Type
New Conventional
Estimated Equity
$451,464
Purchase Details
Closed on
Dec 19, 1994
Sold by
Security Title Agency
Bought by
Regal Homes Inc
Home Financials for this Owner
Home Financials are based on the most recent Mortgage that was taken out on this home.
Original Mortgage
$108,700
Outstanding Balance
$1,760
Interest Rate
9.2%
Mortgage Type
New Conventional
Estimated Equity
$451,464
Create a Home Valuation Report for This Property
The Home Valuation Report is an in-depth analysis detailing your home's value as well as a comparison with similar homes in the area
Home Values in the Area
Average Home Value in this Area
Purchase History
| Date | Buyer | Sale Price | Title Company |
|---|---|---|---|
| Crenshaw George Vogel | -- | None Available | |
| Crenshaw George | -- | -- | |
| Crenshaw George | $124,470 | Security Title Agency | |
| Regal Homes Inc | -- | Security Title Agency |
Source: Public Records
Mortgage History
| Date | Status | Borrower | Loan Amount |
|---|---|---|---|
| Closed | Crenshaw George | $108,700 |
Source: Public Records
Tax History Compared to Growth
Tax History
| Year | Tax Paid | Tax Assessment Tax Assessment Total Assessment is a certain percentage of the fair market value that is determined by local assessors to be the total taxable value of land and additions on the property. | Land | Improvement |
|---|---|---|---|---|
| 2025 | $1,534 | $20,267 | -- | -- |
| 2024 | $1,554 | $19,302 | -- | -- |
| 2023 | $1,554 | $34,720 | $6,940 | $27,780 |
| 2022 | $1,522 | $25,360 | $5,070 | $20,290 |
| 2021 | $1,629 | $23,210 | $4,640 | $18,570 |
| 2020 | $1,644 | $22,350 | $4,470 | $17,880 |
| 2019 | $1,591 | $21,560 | $4,310 | $17,250 |
| 2018 | $1,539 | $20,330 | $4,060 | $16,270 |
| 2017 | $1,539 | $16,850 | $3,370 | $13,480 |
| 2016 | $1,524 | $17,810 | $3,560 | $14,250 |
| 2015 | $1,422 | $17,050 | $3,410 | $13,640 |
Source: Public Records
Map
Nearby Homes
- 8769 W Shaw Butte Dr
- 8861 W Paradise Dr
- 8921 W Paradise Dr
- 8795 W Windsor Dr
- 8733 W Laurel Ln
- 8921 W Laurel Ln
- 8614 W Shaw Butte Dr
- 8854 W Aster Dr
- 8605 W Paradise Dr
- 12512 N 85th Ave
- 13083 N 87th Dr
- 8879 W Cameron Dr
- 8872 W Hollywood Ave
- 8420 W Cherry Hills Dr
- 8863 W Greer Ave
- 13349 N 87th Ln
- 9118 W Cameron Dr
- 8541 W Pershing Ave
- 13585 N 87th Dr
- 13088 N 91st Dr
- 8818 W Charter Oak Rd
- 8812 W Charter Oak Rd
- 8824 W Charter Oak Rd
- 8827 W Bloomfield Rd
- 8815 W Bloomfield Rd
- 8819 W Charter Oak Rd
- 8806 W Charter Oak Rd
- 8813 W Charter Oak Rd
- 8825 W Charter Oak Rd
- 8809 W Bloomfield Rd
- 8807 W Charter Oak Rd
- 8831 W Charter Oak Rd
- 8816 W Wethersfield Rd
- 8836 W Charter Oak Rd
- 8814 W Bloomfield Rd
- 8810 W Wethersfield Rd
- 8750 W Charter Oak Rd
- 8839 W Bloomfield Rd
- 8826 W Bloomfield Rd
- 8755 W Charter Oak Rd