Estimated Value: $70,000 - $106,000
3
Beds
1
Bath
1,638
Sq Ft
$53/Sq Ft
Est. Value
About This Home
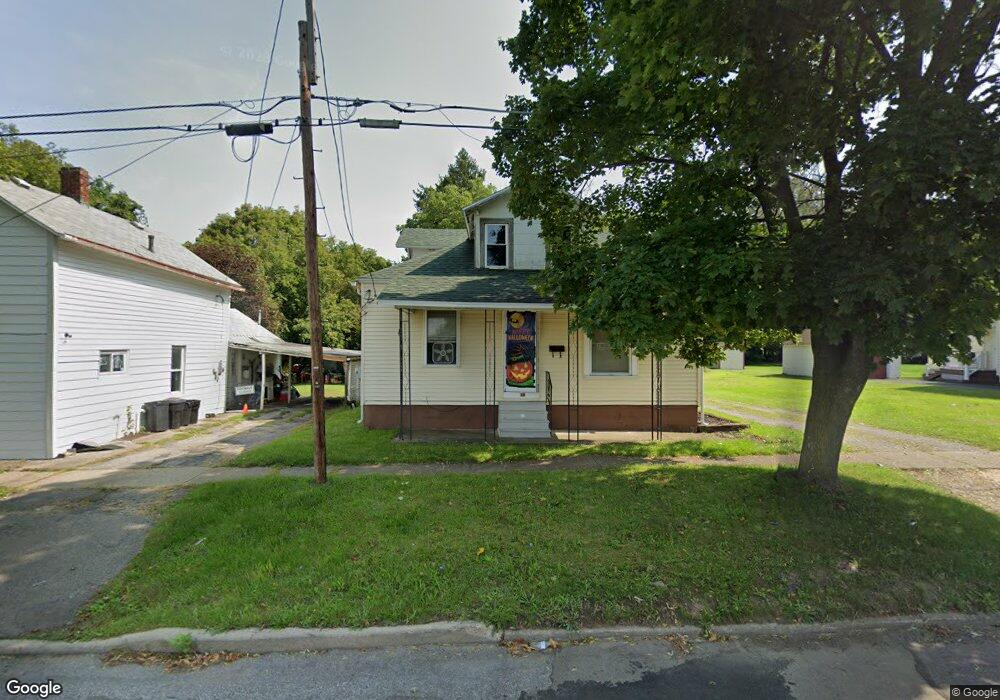
This home is located at 882 N 4th St, Olean, NY 14760 and is currently estimated at $87,589, approximately $53 per square foot. 882 N 4th St is a home located in Cattaraugus County with nearby schools including Olean Intermediate-Middle School, Olean Senior High School, and New Life Christian School.
Ownership History
Date
Name
Owned For
Owner Type
Purchase Details
Closed on
May 5, 2024
Sold by
Reynolds Dillon M and Parker Robbin L
Bought by
Akwy Llc
Current Estimated Value
Purchase Details
Closed on
Mar 11, 2020
Sold by
Russo James A
Bought by
Reynolds Dillon M
Home Financials for this Owner
Home Financials are based on the most recent Mortgage that was taken out on this home.
Original Mortgage
$19,000
Interest Rate
3.4%
Mortgage Type
Stand Alone Refi Refinance Of Original Loan
Purchase Details
Closed on
Mar 10, 2020
Sold by
Russo James A
Bought by
Reynolds Dillon M
Home Financials for this Owner
Home Financials are based on the most recent Mortgage that was taken out on this home.
Original Mortgage
$19,000
Interest Rate
3.4%
Mortgage Type
Stand Alone Refi Refinance Of Original Loan
Purchase Details
Closed on
Aug 18, 2004
Sold by
Cappelletti Helen
Bought by
Russo James
Create a Home Valuation Report for This Property
The Home Valuation Report is an in-depth analysis detailing your home's value as well as a comparison with similar homes in the area
Home Values in the Area
Average Home Value in this Area
Purchase History
| Date | Buyer | Sale Price | Title Company |
|---|---|---|---|
| Akwy Llc | $42,000 | None Available | |
| Reynolds Dillon M | $29,000 | None Available | |
| Reynolds Dillon M | $29,000 | None Available | |
| Russo James | -- | J. Michael Shane | |
| Russo James | -- | J. Michael Shane |
Source: Public Records
Mortgage History
| Date | Status | Borrower | Loan Amount |
|---|---|---|---|
| Previous Owner | Reynolds Dillon M | $19,000 | |
| Previous Owner | Reynolds Dillon M | $19,000 |
Source: Public Records
Tax History
| Year | Tax Paid | Tax Assessment Tax Assessment Total Assessment is a certain percentage of the fair market value that is determined by local assessors to be the total taxable value of land and additions on the property. | Land | Improvement |
|---|---|---|---|---|
| 2025 | $2,687 | $42,500 | $5,400 | $37,100 |
| 2024 | $2,687 | $42,500 | $5,400 | $37,100 |
| 2023 | $1,600 | $42,500 | $5,400 | $37,100 |
| 2022 | $1,623 | $42,500 | $5,400 | $37,100 |
| 2021 | $1,670 | $42,500 | $5,400 | $37,100 |
| 2020 | $1,403 | $42,500 | $5,400 | $37,100 |
| 2019 | $319 | $42,500 | $5,400 | $37,100 |
| 2018 | $636 | $42,500 | $5,400 | $37,100 |
| 2017 | $375 | $42,500 | $5,400 | $37,100 |
| 2016 | $335 | $42,500 | $5,400 | $37,100 |
| 2015 | -- | $42,500 | $5,400 | $37,100 |
| 2014 | -- | $42,500 | $5,400 | $37,100 |
Source: Public Records
Map
Nearby Homes
Your Personal Tour Guide
Ask me questions while you tour the home.