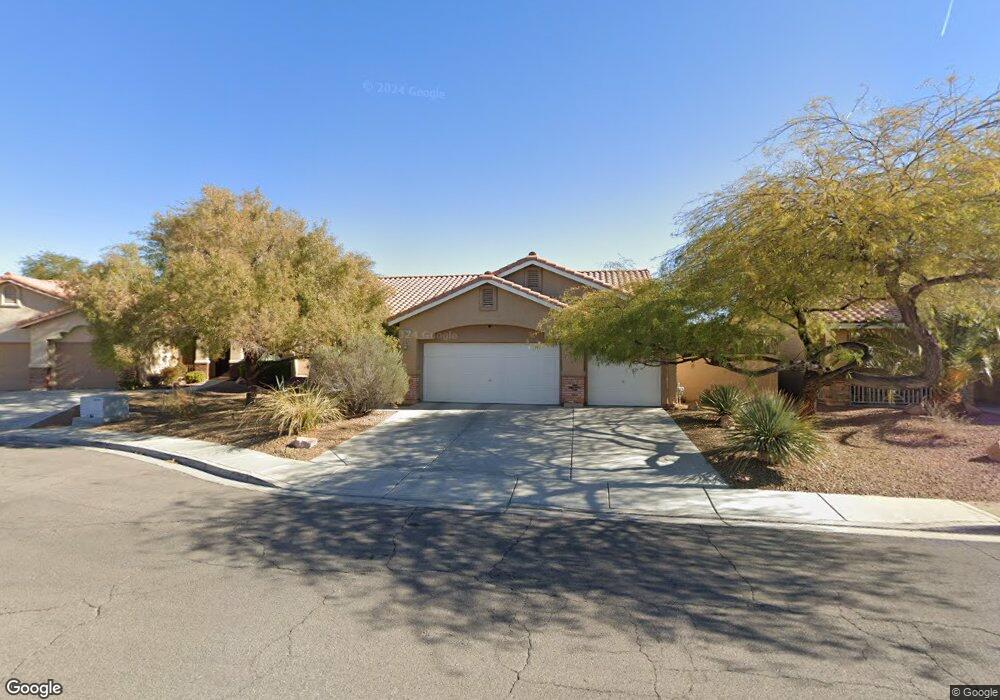
8820 Aurora Light Way Las Vegas, NV 89123
Silverado Ranch NeighborhoodEstimated Value: $493,055 - $559,000
3
Beds
3
Baths
1,904
Sq Ft
$277/Sq Ft
Est. Value
About This Home
This home is located at 8820 Aurora Light Way, Las Vegas, NV 89123 and is currently estimated at $527,764, approximately $277 per square foot. 8820 Aurora Light Way is a home located in Clark County with nearby schools including John R Beatty Elementary School, Jack Lund Schofield Middle School, and Silverado High School.
Ownership History
Date
Name
Owned For
Owner Type
Purchase Details
Closed on
Aug 7, 2024
Sold by
Bagley-Burns Dale C
Bought by
Burns Randall B
Current Estimated Value
Purchase Details
Closed on
May 21, 2003
Sold by
Burns Randall B and Bagley Burns Dale C
Bought by
Bagley Burns Dale C
Home Financials for this Owner
Home Financials are based on the most recent Mortgage that was taken out on this home.
Original Mortgage
$164,000
Outstanding Balance
$71,174
Interest Rate
5.77%
Mortgage Type
Unknown
Estimated Equity
$456,590
Purchase Details
Closed on
Oct 8, 1996
Sold by
Bilt Perma
Bought by
Burns Randall B and Bagley Burns Dale C
Home Financials for this Owner
Home Financials are based on the most recent Mortgage that was taken out on this home.
Original Mortgage
$143,000
Interest Rate
8.1%
Create a Home Valuation Report for This Property
The Home Valuation Report is an in-depth analysis detailing your home's value as well as a comparison with similar homes in the area
Home Values in the Area
Average Home Value in this Area
Purchase History
| Date | Buyer | Sale Price | Title Company |
|---|---|---|---|
| Burns Randall B | -- | None Listed On Document | |
| Bagley Burns Dale C | -- | Equity Title Of Nevada | |
| Burns Randall B | $151,000 | Nevada Title Company |
Source: Public Records
Mortgage History
| Date | Status | Borrower | Loan Amount |
|---|---|---|---|
| Open | Bagley Burns Dale C | $164,000 | |
| Closed | Burns Randall B | $143,000 |
Source: Public Records
Tax History Compared to Growth
Tax History
| Year | Tax Paid | Tax Assessment Tax Assessment Total Assessment is a certain percentage of the fair market value that is determined by local assessors to be the total taxable value of land and additions on the property. | Land | Improvement |
|---|---|---|---|---|
| 2025 | $1,972 | $113,838 | $38,500 | $75,338 |
| 2024 | $1,915 | $113,838 | $38,500 | $75,338 |
| 2023 | $1,563 | $113,632 | $42,000 | $71,632 |
| 2022 | $1,860 | $101,523 | $35,700 | $65,823 |
| 2021 | $1,806 | $93,757 | $31,150 | $62,607 |
| 2020 | $1,750 | $91,887 | $29,750 | $62,137 |
| 2019 | $1,699 | $89,308 | $28,000 | $61,308 |
| 2018 | $1,650 | $82,012 | $22,750 | $59,262 |
| 2017 | $2,383 | $81,246 | $21,000 | $60,246 |
| 2016 | $1,563 | $75,934 | $15,750 | $60,184 |
| 2015 | $1,559 | $64,458 | $11,550 | $52,908 |
| 2014 | $1,514 | $51,902 | $8,750 | $43,152 |
Source: Public Records
Map
Nearby Homes
- 8777 Shady Peak Way Unit 2
- 1006 Coldwater Falls Way
- 8880 Star Valley Ct
- 8644 Emerald Grove Way
- 8959 Coral Shale St
- 973 Park Walk Ave
- 965 Park Walk Ave Unit 5
- 8940 Sandy Slate Way
- 927 Clear Diamond Ave
- 8698 Waterford Bend St
- 0 S Maryland Pkwy
- 9076 Quarrystone Way
- 949 Single Tree Dr
- 8634 Waterford Bend St
- 861 Clear Diamond Ave
- 9106 Sandy Slate Way
- 8840 Quintane Ln
- 8603 Lakota St
- 1596 Little Crow Ave
- 8684 Little Fox St
- 8810 Aurora Light Way Unit 2
- 1065 Garden Breeze Way Unit 2
- 1106 Chestwood Ave
- 1080 Garden Breeze Way Unit 2
- 1066 Country Wind Way
- 1114 Chestwood Ave
- 1060 Garden Breeze Way
- 8829 Keywood St
- 1055 Garden Breeze Way
- 1122 Chestwood Ave
- 8839 Keywood St
- 1056 Country Wind Way
- 1133 Monogram Way Unit 2
- 8860 Aurora Light Way
- 8849 Keywood St
- 1045 Garden Breeze Way
- 1130 Chestwood Ave
- 1071 Whitacre Ct
- 1081 Whitacre Ct