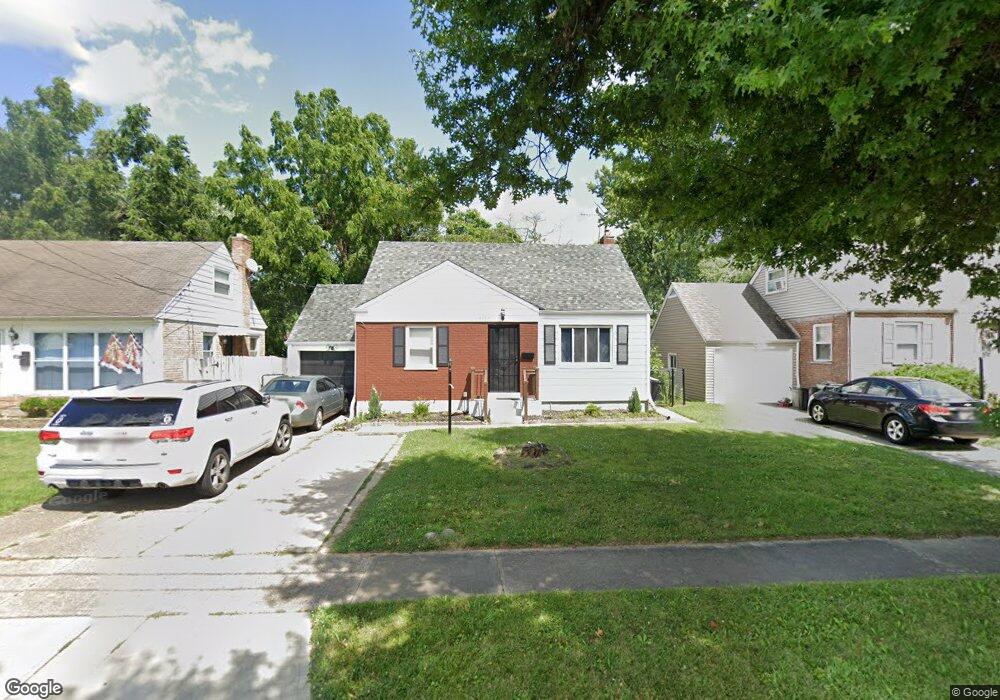
8822 Daly Rd Cincinnati, OH 45231
Finneytown NeighborhoodEstimated Value: $173,000 - $232,000
3
Beds
2
Baths
1,704
Sq Ft
$121/Sq Ft
Est. Value
About This Home
This home is located at 8822 Daly Rd, Cincinnati, OH 45231 and is currently estimated at $205,929, approximately $120 per square foot. 8822 Daly Rd is a home located in Hamilton County with nearby schools including Finneytown Elementary School, Finneytown Secondary Campus, and John Paul II Catholic School.
Ownership History
Date
Name
Owned For
Owner Type
Purchase Details
Closed on
Apr 5, 2023
Sold by
Campbell Custom Homes Ii Inc
Bought by
Simmons Oenicv
Current Estimated Value
Home Financials for this Owner
Home Financials are based on the most recent Mortgage that was taken out on this home.
Original Mortgage
$181,649
Outstanding Balance
$176,647
Interest Rate
6.65%
Mortgage Type
FHA
Estimated Equity
$29,282
Purchase Details
Closed on
Aug 25, 2022
Sold by
Kigar Rick A
Bought by
Campbell Custom Homes Ii Inc
Purchase Details
Closed on
Aug 23, 2016
Sold by
Larkin Lisa L
Bought by
Equity Max Network Llc
Home Financials for this Owner
Home Financials are based on the most recent Mortgage that was taken out on this home.
Original Mortgage
$83,855
Interest Rate
3.5%
Mortgage Type
Land Contract Argmt. Of Sale
Purchase Details
Closed on
Aug 2, 1999
Sold by
Martha Ransick
Bought by
Larkin Lisa L
Home Financials for this Owner
Home Financials are based on the most recent Mortgage that was taken out on this home.
Original Mortgage
$82,412
Interest Rate
7.77%
Mortgage Type
FHA
Create a Home Valuation Report for This Property
The Home Valuation Report is an in-depth analysis detailing your home's value as well as a comparison with similar homes in the area
Home Values in the Area
Average Home Value in this Area
Purchase History
| Date | Buyer | Sale Price | Title Company |
|---|---|---|---|
| Simmons Oenicv | $92,500,000 | None Listed On Document | |
| Campbell Custom Homes Ii Inc | $101,860 | -- | |
| Equity Max Network Llc | $83,855 | None Available | |
| Larkin Lisa L | $83,500 | Ati Title Agency Of Ohio Inc |
Source: Public Records
Mortgage History
| Date | Status | Borrower | Loan Amount |
|---|---|---|---|
| Open | Simmons Oenicv | $181,649 | |
| Previous Owner | Equity Max Network Llc | $83,855 | |
| Previous Owner | Larkin Lisa L | $82,412 | |
| Closed | Simmons Oenicv | $9,250 |
Source: Public Records
Tax History Compared to Growth
Tax History
| Year | Tax Paid | Tax Assessment Tax Assessment Total Assessment is a certain percentage of the fair market value that is determined by local assessors to be the total taxable value of land and additions on the property. | Land | Improvement |
|---|---|---|---|---|
| 2024 | $2,540 | $37,142 | $5,803 | $31,339 |
| 2023 | $2,497 | $37,142 | $5,803 | $31,339 |
| 2022 | $2,721 | $29,373 | $5,723 | $23,650 |
| 2021 | $2,669 | $29,373 | $5,723 | $23,650 |
| 2020 | $2,712 | $29,373 | $5,723 | $23,650 |
| 2019 | $2,491 | $24,892 | $4,851 | $20,041 |
| 2018 | $2,301 | $24,892 | $4,851 | $20,041 |
| 2017 | $2,193 | $24,892 | $4,851 | $20,041 |
| 2016 | $2,411 | $26,912 | $5,268 | $21,644 |
| 2015 | $2,426 | $26,912 | $5,268 | $21,644 |
| 2014 | $2,428 | $26,912 | $5,268 | $21,644 |
| 2013 | $2,472 | $28,326 | $5,544 | $22,782 |
Source: Public Records
Map
Nearby Homes
- 8831 Daly Rd
- 8772 Balboa Dr
- 8840 Grenada Dr
- 8950 Daly Rd
- 8925 Monsanto Dr
- 8734 Grenada Dr
- 1190 Sugartree Ct
- 1151 Hempstead Dr
- 1100 Gracewind Ct
- 8627 Mockingbird Ln
- 8681 Desoto Dr
- 8622 Mockingbird Ln
- 1277 Prospect Place
- 1013 Vacationland Dr
- 1029 Bluejay Dr
- 8491 Daly Rd
- 1458 Van Fleet Ave
- 958 Hollytree Dr
- 8433 Jonfred Ct
- 954 Hollytree Dr