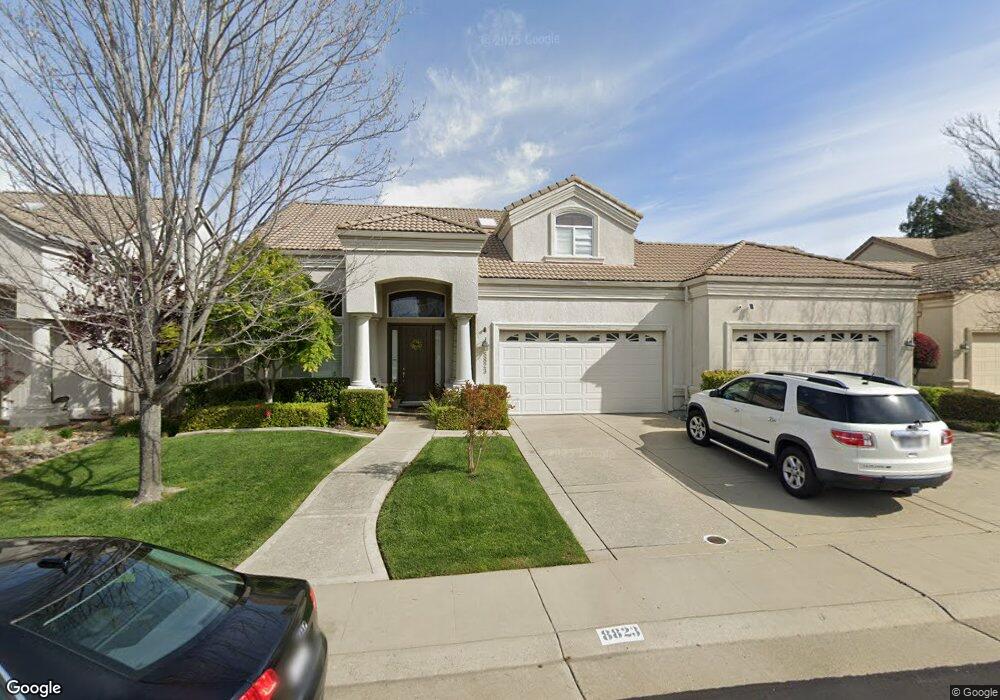
8823 Staplehurst Way Elk Grove, CA 95624
North East Elk Grove NeighborhoodEstimated Value: $730,000 - $839,000
4
Beds
2
Baths
2,683
Sq Ft
$288/Sq Ft
Est. Value
About This Home
This home is located at 8823 Staplehurst Way, Elk Grove, CA 95624 and is currently estimated at $772,303, approximately $287 per square foot. 8823 Staplehurst Way is a home located in Sacramento County with nearby schools including Ellen Feickert Elementary School, Joseph Kerr Middle School, and Elk Grove High School.
Ownership History
Date
Name
Owned For
Owner Type
Purchase Details
Closed on
Nov 9, 2017
Sold by
Reyes Felimon A and Reyes Mila A
Bought by
Reyes Felimon Agnis and Reyes Mila Anders
Current Estimated Value
Purchase Details
Closed on
Sep 20, 2011
Sold by
Wells Fargo Bank Na
Bought by
Reyes Felimon A and Reyes Mila A
Purchase Details
Closed on
Jun 9, 2011
Sold by
Fiksdal Nels John and Fiksdal Anne Marie
Bought by
Wells Fargo Bank Na
Purchase Details
Closed on
Jun 6, 2005
Sold by
Boulder Glen Investors Lp
Bought by
Fiksdal Nels John and Fiksdal Anne Marie
Home Financials for this Owner
Home Financials are based on the most recent Mortgage that was taken out on this home.
Original Mortgage
$459,564
Interest Rate
5.75%
Mortgage Type
Purchase Money Mortgage
Create a Home Valuation Report for This Property
The Home Valuation Report is an in-depth analysis detailing your home's value as well as a comparison with similar homes in the area
Home Values in the Area
Average Home Value in this Area
Purchase History
| Date | Buyer | Sale Price | Title Company |
|---|---|---|---|
| Reyes Felimon Agnis | -- | None Available | |
| Reyes Felimon A | $280,000 | Landsafe Title | |
| Wells Fargo Bank Na | $287,550 | Landsafe Default Inc | |
| Fiksdal Nels John | $574,500 | Placer Title Company |
Source: Public Records
Mortgage History
| Date | Status | Borrower | Loan Amount |
|---|---|---|---|
| Previous Owner | Fiksdal Nels John | $459,564 |
Source: Public Records
Tax History Compared to Growth
Tax History
| Year | Tax Paid | Tax Assessment Tax Assessment Total Assessment is a certain percentage of the fair market value that is determined by local assessors to be the total taxable value of land and additions on the property. | Land | Improvement |
|---|---|---|---|---|
| 2025 | $2,477 | $358,051 | $109,898 | $248,153 |
| 2024 | $2,477 | $351,032 | $107,744 | $243,288 |
| 2023 | $2,473 | $344,150 | $105,632 | $238,518 |
| 2022 | $2,504 | $337,403 | $103,561 | $233,842 |
| 2021 | $2,455 | $330,788 | $101,531 | $229,257 |
| 2020 | $2,453 | $327,397 | $100,490 | $226,907 |
| 2019 | $2,418 | $320,978 | $98,520 | $222,458 |
| 2018 | $2,225 | $314,686 | $96,589 | $218,097 |
| 2017 | $2,200 | $308,517 | $94,696 | $213,821 |
| 2016 | $2,105 | $302,469 | $92,840 | $209,629 |
| 2015 | $2,061 | $297,927 | $91,446 | $206,481 |
| 2014 | $1,967 | $286,896 | $89,655 | $197,241 |
Source: Public Records
Map
Nearby Homes
- 8508 Cottonseed Way
- 8504 Cottonseed Way
- 8500 Cottonseed Way
- 8951 Ivanpah Ct
- 8449 Cottonseed Way
- 8472 Kingsland Ct
- 8469 Brushwood Way
- 8360 Blackman Way
- 8885 Springhurst Dr
- 8747 Gessnger Dr
- 8659 Tegea Way
- 8770 Bottlebrush Ct
- 8822 Wheelton Rd
- 8890 Wheelton Rd
- 8817 J Sheehan St
- 8821 J Sheehan St
- 8581 Petunia Way
- Plan 1462 at Hamilton Park
- Plan 1404 Modeled at Hamilton Park
- Plan 2111 Modeled at Hamilton Park
- 8817 Staplehurst Way
- 8827 Staplehurst Way
- 8572 New Mills Ct
- 8568 New Mills Ct
- 8560 New Mills Ct
- 8576 New Mills Ct
- 8811 Staplehurst Way
- 8824 Staplehurst Way
- 8831 Staplehurst Way
- 8564 New Mills Ct
- 8816 Staplehurst Way
- 0 New Mills Ct Unit 13030231
- 8580 New Mills Ct
- 8810 Staplehurst Way
- 8838 Staplehurst Way
- 8824 Metalmark Ct
- 8839 Staplehurst Way
- 8820 Metalmark Ct
- 8828 Sonoran Way
- 8470 Sheldon Rd