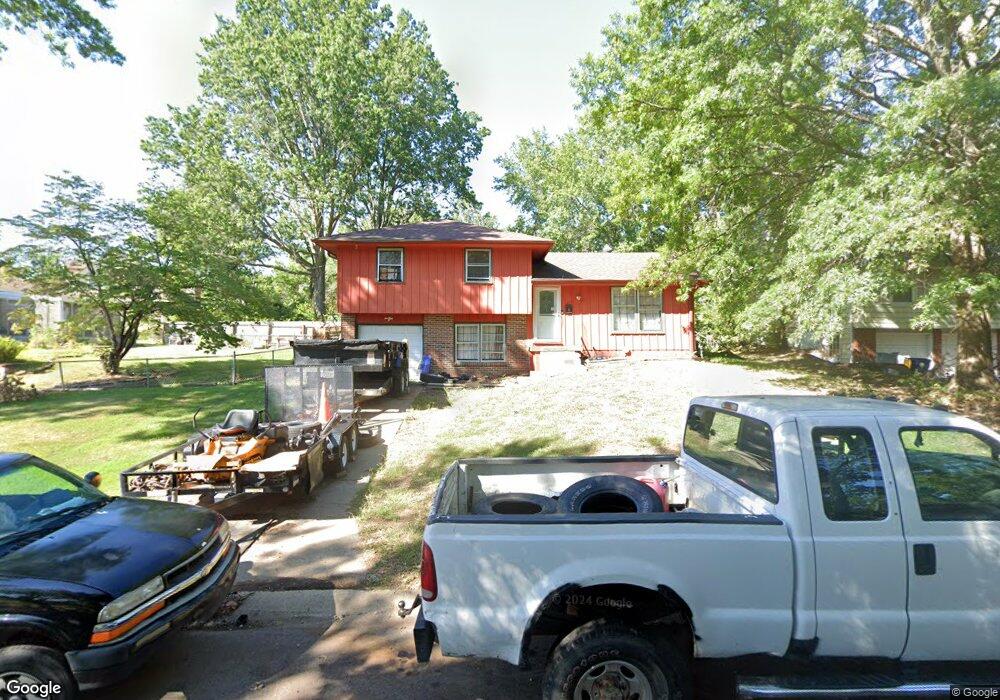
8824 Evanston Way Kansas City, MO 64138
White Oak NeighborhoodEstimated Value: $185,000 - $219,000
3
Beds
2
Baths
1,058
Sq Ft
$195/Sq Ft
Est. Value
About This Home
This home is located at 8824 Evanston Way, Kansas City, MO 64138 and is currently estimated at $205,827, approximately $194 per square foot. 8824 Evanston Way is a home located in Jackson County with nearby schools including Truman Elementary School, St Regis School, and Carver Christian Academy.
Ownership History
Date
Name
Owned For
Owner Type
Purchase Details
Closed on
Aug 16, 2012
Sold by
Travers Thomas E and Travers Julie G
Bought by
Walters Howard C
Current Estimated Value
Home Financials for this Owner
Home Financials are based on the most recent Mortgage that was taken out on this home.
Original Mortgage
$70,000
Interest Rate
3.59%
Mortgage Type
New Conventional
Purchase Details
Closed on
Jan 4, 2010
Sold by
Travers Thomas E and Travers Julie G
Bought by
Travers Thomas E and Travers Julie G
Home Financials for this Owner
Home Financials are based on the most recent Mortgage that was taken out on this home.
Original Mortgage
$125,300
Interest Rate
4.82%
Mortgage Type
Stand Alone Refi Refinance Of Original Loan
Purchase Details
Closed on
Sep 18, 2009
Sold by
Deutsche Bank National Trust Company
Bought by
Travers Thomas E
Purchase Details
Closed on
Jun 4, 2009
Sold by
Wentz Roger L and Wentz Billie J
Bought by
Deutsche Bank National Trust Company
Create a Home Valuation Report for This Property
The Home Valuation Report is an in-depth analysis detailing your home's value as well as a comparison with similar homes in the area
Home Values in the Area
Average Home Value in this Area
Purchase History
| Date | Buyer | Sale Price | Title Company |
|---|---|---|---|
| Walters Howard C | -- | None Available | |
| Travers Thomas E | -- | Stewart Title Company | |
| Travers Thomas E | -- | None Available | |
| Deutsche Bank National Trust Company | $53,725 | None Available |
Source: Public Records
Mortgage History
| Date | Status | Borrower | Loan Amount |
|---|---|---|---|
| Previous Owner | Walters Howard C | $70,000 | |
| Previous Owner | Travers Thomas E | $125,300 |
Source: Public Records
Tax History Compared to Growth
Tax History
| Year | Tax Paid | Tax Assessment Tax Assessment Total Assessment is a certain percentage of the fair market value that is determined by local assessors to be the total taxable value of land and additions on the property. | Land | Improvement |
|---|---|---|---|---|
| 2025 | $2,261 | $21,358 | $4,281 | $17,077 |
| 2024 | $2,220 | $26,116 | $2,333 | $23,783 |
| 2023 | $2,220 | $26,115 | $3,604 | $22,511 |
| 2022 | $1,599 | $16,150 | $3,140 | $13,010 |
| 2021 | $1,379 | $16,150 | $3,140 | $13,010 |
| 2020 | $1,455 | $16,102 | $3,140 | $12,962 |
| 2019 | $1,376 | $16,102 | $3,140 | $12,962 |
| 2018 | $1,283 | $14,014 | $2,733 | $11,281 |
| 2017 | $1,288 | $14,014 | $2,733 | $11,281 |
| 2016 | $1,288 | $13,663 | $3,031 | $10,632 |
| 2014 | $1,248 | $13,395 | $2,972 | $10,423 |
Source: Public Records
Map
Nearby Homes
- 8618 Arlington Ave
- 8529 Crescent Ave
- 9901 E 85th St
- 8525 Maple Ave
- 9425 E 90th Terrace
- 8421 Hawthorne Place
- 9201 E 87th St
- 8512 Maywood Ave
- 9109 E 89th St
- 9334 E 85th St
- 10001 E 84th St
- 9601 E 83rd St
- 9012 E 85th Terrace
- 8925 E 89th St
- 8400 Willow Way
- 8324 Hedges Ave
- 9700 E 82nd Terrace
- 9006 Tennessee Ave
- 8916 E 89th Terrace
- 8320 Willow Way
- 8818 Evanston Way
- 8828 Evanston Way
- 8823 Evanston Way
- 8827 Evanston Way
- 8812 Evanston Way
- 8819 Evanston Way
- 8831 Evanston Way
- 8832 Evanston Way
- 8808 Evanston Way
- 8835 Evanston Way
- 8815 Evanston Way
- 8809 Evanston Ave
- 8819 Evanston Ave
- 8836 Evanston Way
- 8811 Evanston Way
- 8839 Evanston Way
- 8813 Evanston Ave
- 8821 Evanston Ave
- 8804 Evanston Way
- 8844 Evanston Way