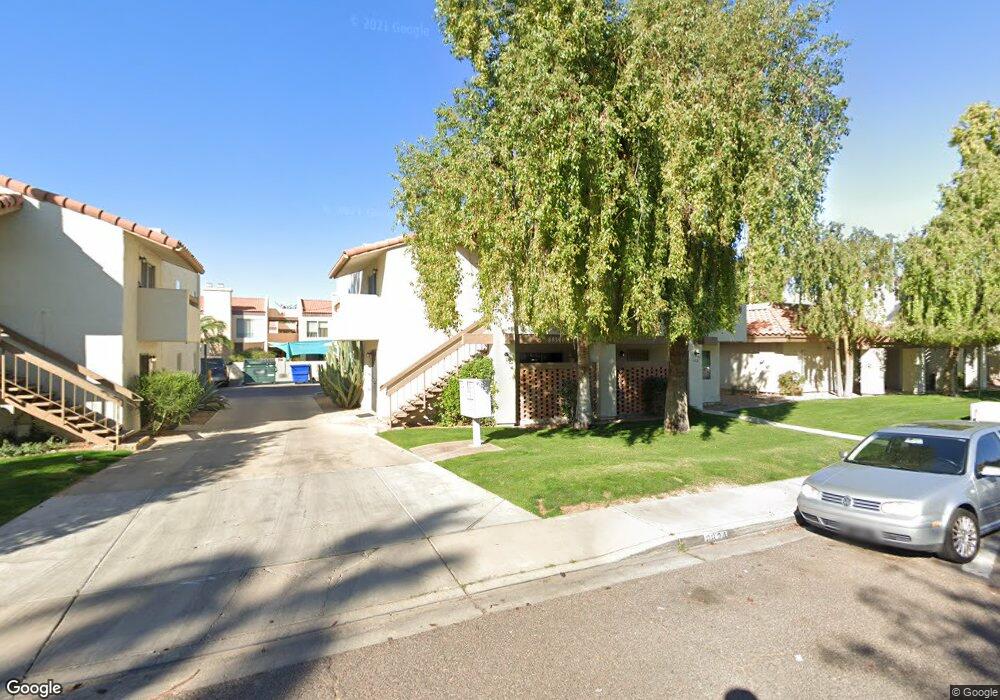
8824 N 8th St Unit 16D Phoenix, AZ 85020
North Central NeighborhoodEstimated Value: $124,000 - $168,000
--
Bed
1
Bath
510
Sq Ft
$272/Sq Ft
Est. Value
About This Home
This home is located at 8824 N 8th St Unit 16D, Phoenix, AZ 85020 and is currently estimated at $138,471, approximately $271 per square foot. 8824 N 8th St Unit 16D is a home located in Maricopa County with nearby schools including Desert View Elementary School, Royal Palm Middle School, and Sunnyslope High School.
Ownership History
Date
Name
Owned For
Owner Type
Purchase Details
Closed on
Feb 19, 2003
Sold by
402 Property Wholesalers Llc
Bought by
Hughes Anthony J
Current Estimated Value
Purchase Details
Closed on
Feb 14, 2003
Sold by
Mgf Funding Inc
Bought by
402 Property Wholesalers Llc
Purchase Details
Closed on
Jun 28, 2002
Sold by
Rovella Louis R
Bought by
Jdc Investments Llc
Purchase Details
Closed on
Feb 8, 2001
Sold by
Brown Madaline Fern
Bought by
Rovella Louis R
Home Financials for this Owner
Home Financials are based on the most recent Mortgage that was taken out on this home.
Original Mortgage
$22,000
Interest Rate
8.37%
Mortgage Type
New Conventional
Create a Home Valuation Report for This Property
The Home Valuation Report is an in-depth analysis detailing your home's value as well as a comparison with similar homes in the area
Home Values in the Area
Average Home Value in this Area
Purchase History
| Date | Buyer | Sale Price | Title Company |
|---|---|---|---|
| Hughes Anthony J | $29,900 | First American Title Ins Co | |
| 402 Property Wholesalers Llc | -- | First American Title Ins Co | |
| Jdc Investments Llc | $25,000 | -- | |
| Rovella Louis R | $27,500 | Grand Canyon Title Agency In |
Source: Public Records
Mortgage History
| Date | Status | Borrower | Loan Amount |
|---|---|---|---|
| Previous Owner | Rovella Louis R | $22,000 |
Source: Public Records
Tax History Compared to Growth
Tax History
| Year | Tax Paid | Tax Assessment Tax Assessment Total Assessment is a certain percentage of the fair market value that is determined by local assessors to be the total taxable value of land and additions on the property. | Land | Improvement |
|---|---|---|---|---|
| 2025 | $269 | $2,412 | -- | -- |
| 2024 | $253 | $2,297 | -- | -- |
| 2023 | $253 | $8,510 | $1,700 | $6,810 |
| 2022 | $244 | $6,460 | $1,290 | $5,170 |
| 2021 | $251 | $5,380 | $1,070 | $4,310 |
| 2020 | $244 | $4,170 | $830 | $3,340 |
| 2019 | $239 | $3,310 | $660 | $2,650 |
| 2018 | $233 | $3,280 | $650 | $2,630 |
| 2017 | $232 | $2,880 | $570 | $2,310 |
| 2016 | $228 | $2,950 | $590 | $2,360 |
| 2015 | $211 | $2,260 | $450 | $1,810 |
Source: Public Records
Map
Nearby Homes
- 8838 N 8th St Unit B12
- 8842 N 8th St Unit 103
- 8821 N 7th St Unit 200
- 8821 N 7th St Unit 100
- 8847 N 8th St Unit 205
- 844 E Townley Ave
- 8939 N 8th St
- 8911 N 10th St
- 8921 N 10th St
- 8916 N 11th St
- 9007 N 11th St Unit 35
- 1002 E Butler Dr
- 833 E Butler Dr
- 1114 E Orchid Ln
- 8910 N 3rd St
- 9239 N Cave Creek Rd
- 9033 N 11th St
- 9047 N 11th St
- 1145 E Eva St
- 1130 E Butler Dr Unit B4
- 8824 N 8th St Unit 204
- 8824 N 8th St Unit 203
- 8824 N 8th St Unit 10D
- 8824 N 8th St Unit 10C
- 8824 N 8th St Unit 10B
- 8824 N 8th St Unit 10A
- 8824 N 8th St Unit 16B
- 8824 N 8th St Unit 16A
- 8824 N 8th St Unit 16I
- 8824 N 8th St Unit 16H
- 8824 N 8th St Unit 16G
- 8824 N 8th St Unit 16F
- 8824 N 8th St Unit 16E
- 8824 N 8th St Unit 16C
- 8824 N 8th St Unit A16
- 8824 N 8th St Unit 209
- 8824 N 8th St Unit 101
- 8820 N 8th St Unit 204
- 8820 N 8th St Unit 8B
- 8820 N 8th St Unit 8D