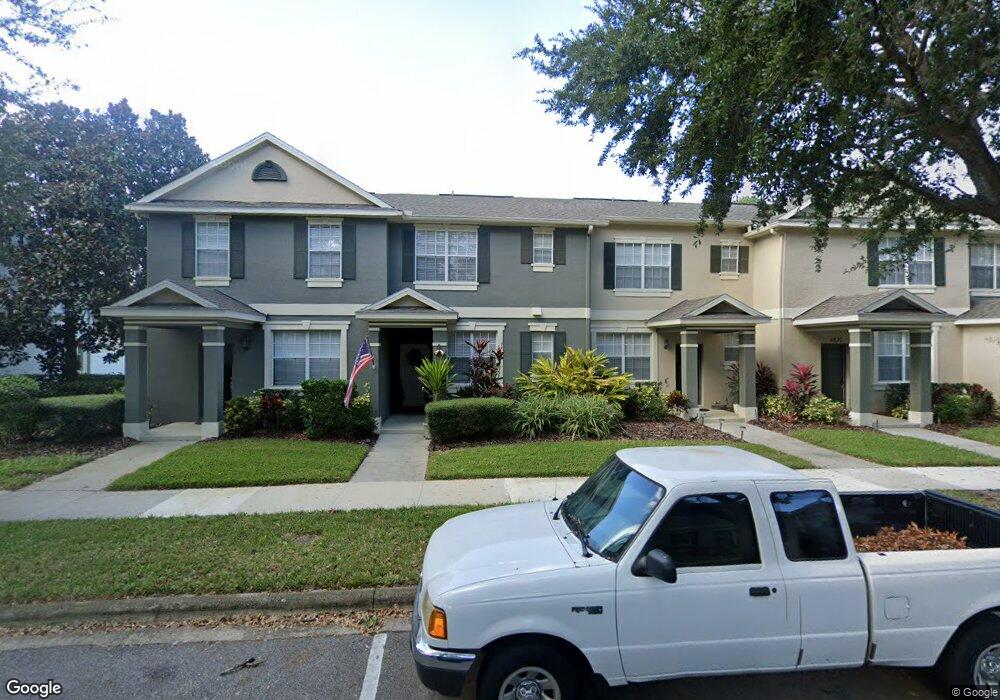
8828 Danforth Dr Windermere, FL 34786
Estimated Value: $295,000 - $359,000
2
Beds
3
Baths
1,875
Sq Ft
$178/Sq Ft
Est. Value
About This Home
This home is located at 8828 Danforth Dr, Windermere, FL 34786 and is currently estimated at $334,676, approximately $178 per square foot. 8828 Danforth Dr is a home located in Orange County with nearby schools including Bay Lake Elementary School, Horizon West Middle School, and Windermere High School.
Ownership History
Date
Name
Owned For
Owner Type
Purchase Details
Closed on
Feb 26, 2016
Sold by
Tony O Leary and Leary Pauline O
Bought by
Leary Paul T O and Bennecke Frederick C
Current Estimated Value
Home Financials for this Owner
Home Financials are based on the most recent Mortgage that was taken out on this home.
Original Mortgage
$175,750
Outstanding Balance
$140,341
Interest Rate
3.92%
Mortgage Type
New Conventional
Estimated Equity
$194,335
Purchase Details
Closed on
Sep 17, 2010
Sold by
Godsey Cristopher W and Garcia Lemarie
Bought by
Oleary Tony and Oleary Pauline
Purchase Details
Closed on
May 18, 2004
Sold by
Ashton Orlando Residential Llc
Bought by
Godsey Christopher W and Garcia Lemarie
Home Financials for this Owner
Home Financials are based on the most recent Mortgage that was taken out on this home.
Original Mortgage
$154,360
Interest Rate
5.62%
Mortgage Type
Purchase Money Mortgage
Create a Home Valuation Report for This Property
The Home Valuation Report is an in-depth analysis detailing your home's value as well as a comparison with similar homes in the area
Home Values in the Area
Average Home Value in this Area
Purchase History
| Date | Buyer | Sale Price | Title Company |
|---|---|---|---|
| Leary Paul T O | $185,000 | Closing Time Title Inc | |
| Oleary Tony | $107,000 | Attorney | |
| Godsey Christopher W | $162,500 | Dba Southern Stewart Title |
Source: Public Records
Mortgage History
| Date | Status | Borrower | Loan Amount |
|---|---|---|---|
| Open | Leary Paul T O | $175,750 | |
| Previous Owner | Godsey Christopher W | $154,360 |
Source: Public Records
Tax History
| Year | Tax Paid | Tax Assessment Tax Assessment Total Assessment is a certain percentage of the fair market value that is determined by local assessors to be the total taxable value of land and additions on the property. | Land | Improvement |
|---|---|---|---|---|
| 2025 | $3,000 | $202,282 | -- | -- |
| 2024 | $2,617 | $196,581 | -- | -- |
| 2023 | $2,617 | $185,477 | $0 | $0 |
| 2022 | $2,499 | $180,075 | $0 | $0 |
| 2021 | $2,465 | $174,830 | $0 | $0 |
| 2020 | $2,332 | $172,416 | $0 | $0 |
| 2019 | $2,390 | $168,540 | $0 | $0 |
| 2018 | $2,368 | $165,397 | $0 | $0 |
| 2017 | $2,321 | $161,995 | $30,000 | $131,995 |
| 2016 | $2,785 | $160,024 | $32,000 | $128,024 |
| 2015 | $2,615 | $145,388 | $26,000 | $119,388 |
| 2014 | $2,396 | $123,227 | $22,000 | $101,227 |
Source: Public Records
Map
Nearby Homes
- 12683 Langstaff Dr
- 8638 Brookvale Dr
- 12327 Cruxbury Dr
- 12353 Via Derna Place
- 12333 Via Derna Place
- 9257 Outlook Rock Trail
- 12305 Via Derna Place
- 12121 Silverlake Park Dr
- 9210 Royal Estates Blvd
- 8648 Powder Ridge Trail
- 9442 Royal Estates Blvd
- 9150 Outlook Rock Trail
- 8582 Powder Ridge Trail
- 11903 Cave Run Ave
- 8552 Powder Ridge Trail
- 11922 Angle Pond Ave
- 8724 Peachtree Park Ct
- 8742 Peachtree Park Ct
- 11816 Angle Pond Ave
- 11835 Gold Creek Trail
- 8824 Danforth Dr
- 8820 Danforth Dr
- 8832 Danforth Dr
- 8816 Danforth Dr
- 8812 Danforth Dr Unit 105
- 8812 Danforth Dr
- 8808 Danforth Dr
- 8844 Danforth Dr
- 8804 Danforth Dr
- 8848 Danforth Dr
- 8852 Danforth Dr
- 8856 Danforth Dr
- 8856 Danforth Dr Unit 8856
- 8776 Danforth Dr
- 8825 Danforth Dr
- 8829 Danforth Dr
- 8860 Danforth Dr
- 8821 Danforth Dr
- 8833 Danforth Dr
- 8817 Danforth Dr
Your Personal Tour Guide
Ask me questions while you tour the home.