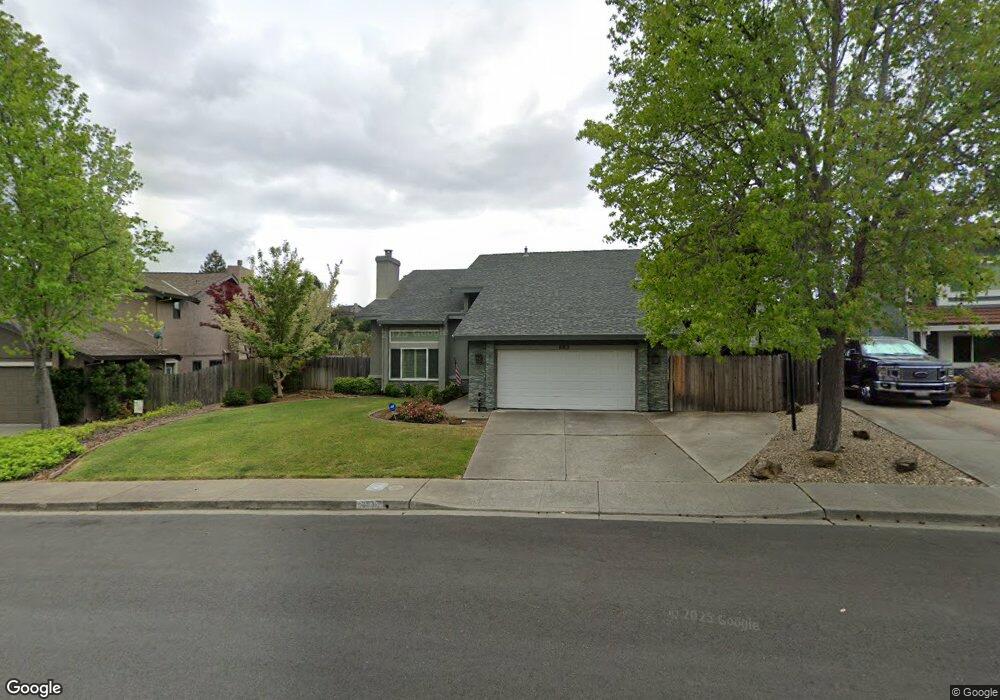
883 Dover Cir Benicia, CA 94510
Estimated Value: $921,000 - $1,043,000
4
Beds
3
Baths
2,942
Sq Ft
$335/Sq Ft
Est. Value
About This Home
This home is located at 883 Dover Cir, Benicia, CA 94510 and is currently estimated at $984,478, approximately $334 per square foot. 883 Dover Cir is a home located in Solano County with nearby schools including Matthew Turner Elementary School, Benicia Middle School, and Benicia High School.
Ownership History
Date
Name
Owned For
Owner Type
Purchase Details
Closed on
Mar 18, 2025
Sold by
Feiglstok Kimberly P
Bought by
Kimberly P Feiglstok 2025 Trust and Feiglstok
Current Estimated Value
Purchase Details
Closed on
Nov 10, 2011
Sold by
Feiglstok David M
Bought by
Feiglstok Kimberly P
Home Financials for this Owner
Home Financials are based on the most recent Mortgage that was taken out on this home.
Original Mortgage
$250,000
Interest Rate
3.87%
Mortgage Type
New Conventional
Purchase Details
Closed on
Jun 17, 1996
Sold by
Garrity John M and Garrity Kimberly R
Bought by
Feiglstok David M and Feiglstok Kimberly P
Home Financials for this Owner
Home Financials are based on the most recent Mortgage that was taken out on this home.
Original Mortgage
$203,500
Interest Rate
8.25%
Create a Home Valuation Report for This Property
The Home Valuation Report is an in-depth analysis detailing your home's value as well as a comparison with similar homes in the area
Home Values in the Area
Average Home Value in this Area
Purchase History
| Date | Buyer | Sale Price | Title Company |
|---|---|---|---|
| Kimberly P Feiglstok 2025 Trust | -- | None Listed On Document | |
| Feiglstok Kimberly P | -- | Old Republic Title Company | |
| Feiglstok David M | $263,500 | Chicago Title Co |
Source: Public Records
Mortgage History
| Date | Status | Borrower | Loan Amount |
|---|---|---|---|
| Previous Owner | Feiglstok Kimberly P | $250,000 | |
| Previous Owner | Feiglstok David M | $203,500 |
Source: Public Records
Tax History
| Year | Tax Paid | Tax Assessment Tax Assessment Total Assessment is a certain percentage of the fair market value that is determined by local assessors to be the total taxable value of land and additions on the property. | Land | Improvement |
|---|---|---|---|---|
| 2025 | $5,287 | $450,748 | $107,977 | $342,771 |
| 2024 | $5,287 | $441,910 | $105,860 | $336,050 |
| 2023 | $5,160 | $433,246 | $103,785 | $329,461 |
| 2022 | $5,064 | $424,751 | $101,750 | $323,001 |
| 2021 | $4,961 | $416,423 | $99,755 | $316,668 |
| 2020 | $4,895 | $412,154 | $98,733 | $313,421 |
| 2019 | $4,811 | $404,074 | $96,798 | $307,276 |
| 2018 | $4,688 | $396,151 | $94,900 | $301,251 |
| 2017 | $4,580 | $388,385 | $93,040 | $295,345 |
| 2016 | $4,616 | $380,770 | $91,216 | $289,554 |
| 2015 | $4,499 | $375,051 | $89,846 | $285,205 |
| 2014 | $4,446 | $367,706 | $88,087 | $279,619 |
Source: Public Records
Map
Nearby Homes
- 850 Leeds Ct
- 771 Rose Dr
- 414 Brunswick Dr
- 8707 Aquamarine Dr
- 8632 Rockaway Dr
- 8620 Rockaway Dr
- 128 Newcastle Dr
- 111 Elgin Ct
- 8601 Rockaway Dr
- 1466 Granada St
- 185 Lexington Dr
- 479 Aragon St
- 570 Periwinkle Place
- 112 Aragon Ct
- 730 Britannia Dr
- 900 Cambridge Dr Unit 56
- 900 Cambridge Dr Unit 114
- 900 Cambridge Dr Unit 104
- 108 Sunnyglen Dr
- 22 Brighton Dr
Your Personal Tour Guide
Ask me questions while you tour the home.