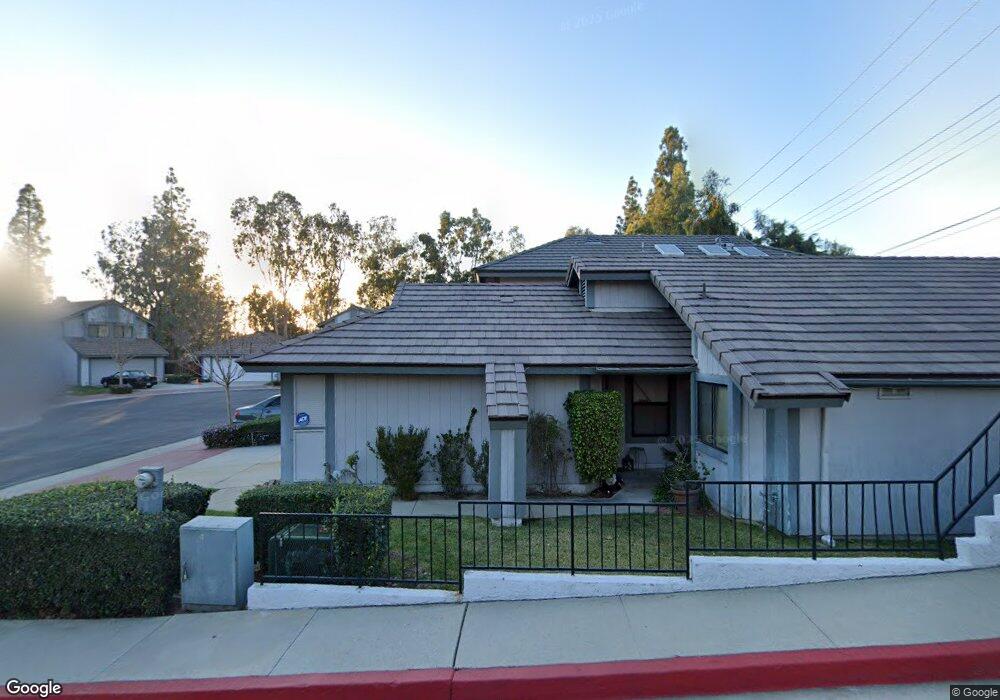
883 El Paso Ct San Dimas, CA 91773
Estimated Value: $695,000 - $740,000
About This Home
This home is located at 883 El Paso Ct, San Dimas, CA 91773 and is currently estimated at $723,502, approximately $413 per square foot. 883 El Paso Ct is a home located in Los Angeles County with nearby schools including Allen Avenue Elementary School, Lone Hill Middle School, and San Dimas High School.
Ownership History
We collect this data history from publicly available records. To have your information removed, we recommend requesting removal directly through your county’s website.
Purchase Details
Purchase Details
Purchase Details
Home Financials for this Owner
Home Financials are based on the most recent Mortgage that was taken out on this home.Purchase Details
Home Values in the Area
Average Home Value in this Area
Purchase History
We collect this data history from publicly available records. To have your information removed, we recommend requesting removal directly through your county’s website.
| Date | Buyer | Sale Price | Title Company |
|---|---|---|---|
| -- | -- | ||
| $150,000 | Old Republic Title Company | ||
| $148,000 | -- | ||
| $128,932 | North American Title Company |
Mortgage History
We collect this data history from publicly available records. To have your information removed, we recommend requesting removal directly through your county’s website.
| Date | Status | Borrower | Loan Amount |
|---|---|---|---|
| Previous Owner | $140,600 |
Tax History
We collect this data history from publicly available records. To have your information removed, we recommend requesting removal directly through your county’s website.
| Year | Tax Paid | Tax Assessment Tax Assessment Total Assessment is a certain percentage of the fair market value that is determined by local assessors to be the total taxable value of land and additions on the property. | Land | Improvement |
|---|---|---|---|---|
| 2025 | $3,477 | $239,483 | $75,511 | $163,972 |
| 2024 | $3,234 | $234,788 | $74,031 | $160,757 |
| 2023 | $3,163 | $230,185 | $72,580 | $157,605 |
| 2022 | $3,108 | $225,672 | $71,157 | $154,515 |
| 2021 | $3,039 | $221,248 | $69,762 | $151,486 |
| 2019 | $2,977 | $214,688 | $67,694 | $146,994 |
| 2018 | $2,820 | $210,479 | $66,367 | $144,112 |
| 2016 | $2,702 | $202,308 | $63,791 | $138,517 |
| 2015 | $2,662 | $199,270 | $62,833 | $136,437 |
| 2014 | $2,643 | $195,368 | $61,603 | $133,765 |
Map
- 850 Tucson Ct
- 913 Durango Ct
- 845 Tucson Ct
- 736 N Walnut Ave
- 133 W Alford St
- 107 E Baseline Rd
- 832 N Oceanbluff Ave
- 318 E Gladstone St
- 612 N Maryport Ave
- 0 Dallas Rd Unit WS25141209
- 909 Lotus Cir
- 619 N Pershore Ave
- 436 440 W 2nd St
- 0 Burnwood Dr Unit CV26062892
- 435 E Baseline Rd
- 208 E 3rd St
- 819 N Shaftesbury Ave
- 316 W 5th St
- 350 E Juanita Ave
- 0 0 W 5th St
Ask me questions while you tour the home.