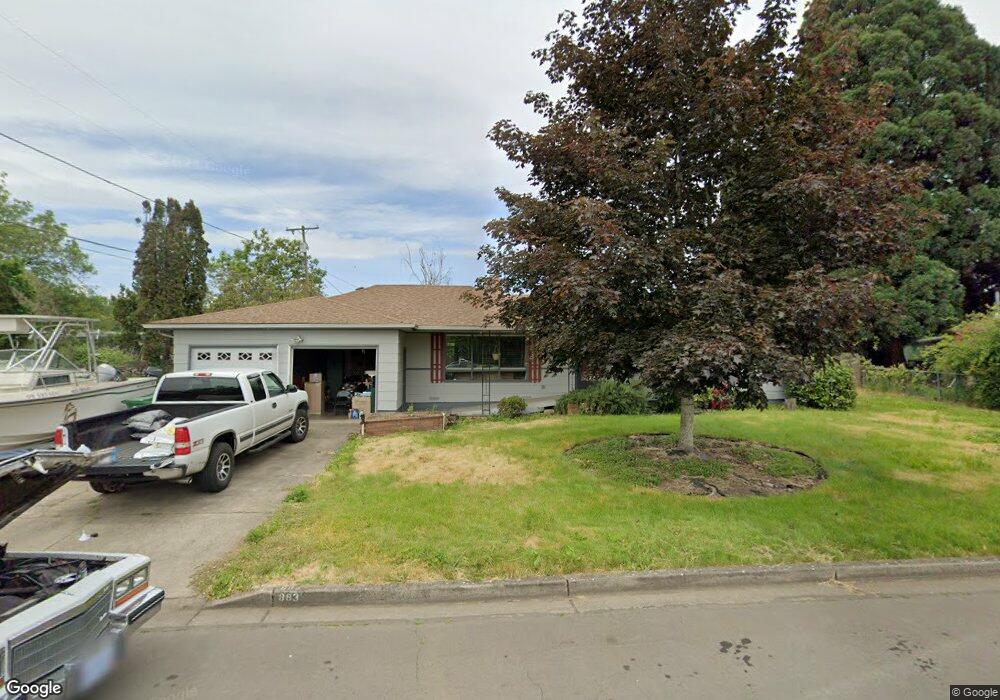
883 Greg Way Eugene, OR 97404
River Road NeighborhoodEstimated Value: $409,243 - $442,000
3
Beds
2
Baths
1,302
Sq Ft
$326/Sq Ft
Est. Value
About This Home
This home is located at 883 Greg Way, Eugene, OR 97404 and is currently estimated at $424,811, approximately $326 per square foot. 883 Greg Way is a home located in Lane County with nearby schools including Howard Elementary School, Kelly Middle School, and North Eugene High School.
Ownership History
Date
Name
Owned For
Owner Type
Purchase Details
Closed on
Nov 3, 2017
Sold by
Huff Sherry A
Bought by
Huff Michael S
Current Estimated Value
Purchase Details
Closed on
Oct 17, 2007
Sold by
Berry Christopher Lynn and Berry Susanna I
Bought by
Huff Michael S and Huff Sherry A
Home Financials for this Owner
Home Financials are based on the most recent Mortgage that was taken out on this home.
Original Mortgage
$195,024
Outstanding Balance
$121,564
Interest Rate
6.27%
Mortgage Type
Purchase Money Mortgage
Estimated Equity
$303,247
Purchase Details
Closed on
Mar 4, 2005
Sold by
Daversa Mark S and Daversa Mary A
Bought by
Berry Christopher Lynn and Berry Susanna I
Home Financials for this Owner
Home Financials are based on the most recent Mortgage that was taken out on this home.
Original Mortgage
$130,360
Interest Rate
5.65%
Mortgage Type
Purchase Money Mortgage
Purchase Details
Closed on
Jan 19, 1999
Sold by
Darling Charles M and Darling Kimberly A
Bought by
Daversa Mark S and Daversa Mary A
Home Financials for this Owner
Home Financials are based on the most recent Mortgage that was taken out on this home.
Original Mortgage
$98,800
Interest Rate
6.63%
Create a Home Valuation Report for This Property
The Home Valuation Report is an in-depth analysis detailing your home's value as well as a comparison with similar homes in the area
Home Values in the Area
Average Home Value in this Area
Purchase History
| Date | Buyer | Sale Price | Title Company |
|---|---|---|---|
| Huff Michael S | -- | None Available | |
| Huff Michael S | $243,780 | Western Title & Escrow Compa | |
| Berry Christopher Lynn | $162,950 | Western Title & Escrow Compa | |
| Daversa Mark S | $123,500 | Fidelity National Title Ins |
Source: Public Records
Mortgage History
| Date | Status | Borrower | Loan Amount |
|---|---|---|---|
| Open | Huff Michael S | $195,024 | |
| Previous Owner | Berry Christopher Lynn | $130,360 | |
| Previous Owner | Daversa Mark S | $98,800 |
Source: Public Records
Tax History
| Year | Tax Paid | Tax Assessment Tax Assessment Total Assessment is a certain percentage of the fair market value that is determined by local assessors to be the total taxable value of land and additions on the property. | Land | Improvement |
|---|---|---|---|---|
| 2025 | $3,368 | $206,303 | -- | -- |
| 2024 | $3,333 | $200,295 | -- | -- |
| 2023 | $3,333 | $194,462 | -- | -- |
| 2022 | $3,134 | $188,799 | $0 | $0 |
| 2021 | $2,912 | $183,300 | $0 | $0 |
| 2020 | $2,935 | $177,962 | $0 | $0 |
| 2019 | $2,831 | $172,779 | $0 | $0 |
| 2018 | $2,638 | $162,861 | $0 | $0 |
| 2017 | $2,525 | $162,861 | $0 | $0 |
| 2016 | $2,377 | $158,117 | $0 | $0 |
| 2015 | $2,288 | $153,512 | $0 | $0 |
| 2014 | $2,214 | $149,041 | $0 | $0 |
Source: Public Records
Map
Nearby Homes
- 1755 Brentwood Ave
- 1682 Hemlock St
- 541 Durham Ave
- 1307 Bramblewood Ln
- 1566 Maywood Ave
- 401 Sterling Dr
- 303 Lenore Loop
- 2563 York St
- 1880 Manihi Dr
- 2439 Quince St
- 805 Impala Ave
- 389 Maxwell Rd
- 2488 Northampton
- 2721 La Darrah St
- 193 Santa Clara Ave
- 215 Jonquil Ave
- 349 Irving Rd
- 200 Irving Rd
- 1487 Barton St
- 1483 Barton St
Your Personal Tour Guide
Ask me questions while you tour the home.