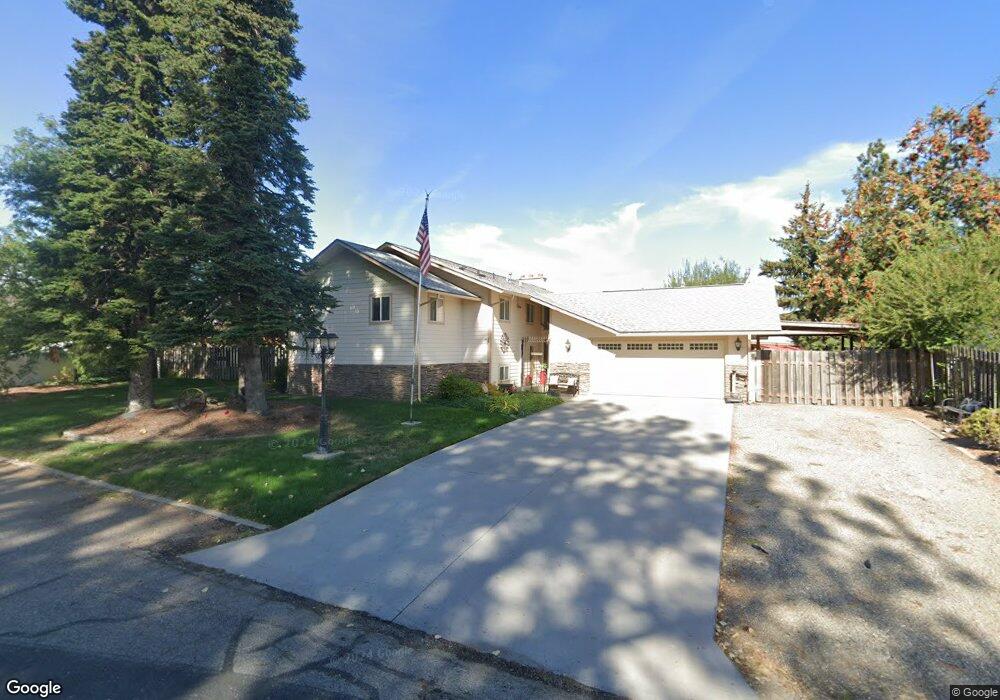
883 N Glasgow Dr Post Falls, ID 83854
The Highlands NeighborhoodEstimated Value: $695,641 - $918,000
3
Beds
3
Baths
3,106
Sq Ft
$256/Sq Ft
Est. Value
About This Home
This home is located at 883 N Glasgow Dr, Post Falls, ID 83854 and is currently estimated at $796,160, approximately $256 per square foot. 883 N Glasgow Dr is a home located in Kootenai County with nearby schools including Ponderosa Elementary School, Post Falls Middle School, and Post Falls High School.
Ownership History
Date
Name
Owned For
Owner Type
Purchase Details
Closed on
Dec 18, 2019
Sold by
Woodrum Randall D and Woodrum Sheri L
Bought by
Woodrum Randall D and Woodrum Sheri L
Current Estimated Value
Purchase Details
Closed on
Mar 30, 2017
Sold by
Miller Harold E and Miller Phyllis J
Bought by
Woodrum Randall D and Woodrum Sheri L
Home Financials for this Owner
Home Financials are based on the most recent Mortgage that was taken out on this home.
Original Mortgage
$214,000
Outstanding Balance
$177,362
Interest Rate
4.15%
Mortgage Type
VA
Estimated Equity
$618,798
Purchase Details
Closed on
Oct 6, 2005
Sold by
Clark Joseph N and Clark Judith E
Bought by
Miller Harold E and Miller Phyllis J
Home Financials for this Owner
Home Financials are based on the most recent Mortgage that was taken out on this home.
Original Mortgage
$55,000
Interest Rate
5.7%
Mortgage Type
New Conventional
Create a Home Valuation Report for This Property
The Home Valuation Report is an in-depth analysis detailing your home's value as well as a comparison with similar homes in the area
Home Values in the Area
Average Home Value in this Area
Purchase History
| Date | Buyer | Sale Price | Title Company |
|---|---|---|---|
| Woodrum Randall D | -- | None Available | |
| Woodrum Randall D | -- | Titleone Boise | |
| Miller Harold E | -- | -- |
Source: Public Records
Mortgage History
| Date | Status | Borrower | Loan Amount |
|---|---|---|---|
| Open | Woodrum Randall D | $214,000 | |
| Previous Owner | Miller Harold E | $55,000 |
Source: Public Records
Tax History
| Year | Tax Paid | Tax Assessment Tax Assessment Total Assessment is a certain percentage of the fair market value that is determined by local assessors to be the total taxable value of land and additions on the property. | Land | Improvement |
|---|---|---|---|---|
| 2025 | $1,803 | $671,250 | $178,500 | $492,750 |
| 2024 | $1,844 | $663,890 | $170,000 | $493,890 |
| 2023 | $1,844 | $678,379 | $224,000 | $454,379 |
| 2022 | $2,673 | $791,974 | $224,000 | $567,974 |
| 2021 | $2,640 | $525,120 | $160,000 | $365,120 |
| 2020 | $1,073 | $428,650 | $125,000 | $303,650 |
| 2019 | $2,429 | $393,210 | $100,000 | $293,210 |
| 2018 | $3,279 | $369,330 | $100,000 | $269,330 |
| 2017 | $2,222 | $325,860 | $85,000 | $240,860 |
| 2016 | $1,331 | $219,520 | $70,000 | $149,520 |
| 2015 | -- | $222,470 | $70,000 | $152,470 |
Source: Public Records
Map
Nearby Homes
- 940 N Harlequin Dr
- 4502 E Savea Ln
- 4550 E Savea Ln
- 4497 E Savea Ln
- 4570 E Savea Ln
- 4519 E Savea Ln
- 4422 E Savea Ln
- 4477 E Davin Dr
- 4451 E Davin Dr
- 4577 E Davin Dr
- 1356 N Highway 41 Unit 6
- 1638 N Havichur Loop
- 690 N McDonald Ct
- 4470 E 16th Ave Unit 33
- 3683 E Mullan Ave
- 750 N Dundee Dr
- 1366 N Brookhaven Ln
- NNA E Mullan Ave
- 3414 E 12th Ave
- 1253 N Monticello St
- 907 N Glasgow Dr
- 875 N Glasgow Dr
- 865 N Glasgow Dr
- 933 N Glasgow Dr
- 4591 E Inverness Dr
- 4631 E Inverness Dr
- 957 N Glasgow Dr
- 944 N Glasgow Dr
- 4571 Inverness Dr
- 4183 E Quail Acres Rd
- 4141 E Quail Acres Rd
- 4671 Inverness Dr
- 980 N Glasgow Dr
- 981 N Glasgow Dr
- 4239 E Quail Acres Rd
- 4551 E Inverness Dr
- 4600 E Inverness Dr
- 4077 E Quail Acres Rd
- 4711 E Inverness Dr
- 4630 E Inverness Dr
Your Personal Tour Guide
Ask me questions while you tour the home.