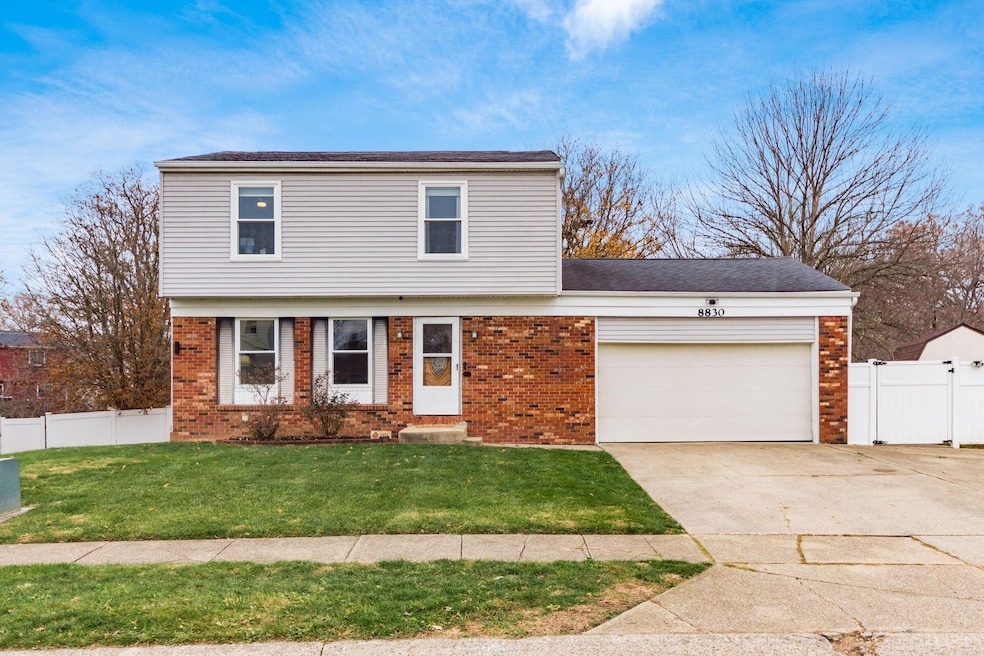
8830 Hubbard Dr N Galloway, OH 43119
Estimated payment $2,064/month
Highlights
- Popular Property
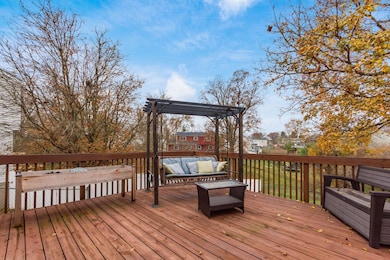
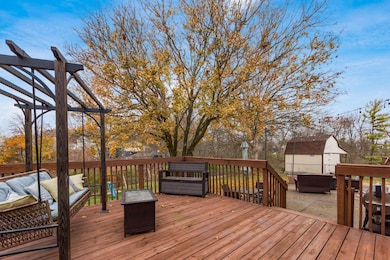
- Deck
- Wood Flooring
- Hilliard Memorial Middle School Rated 10
- Traditional Architecture
- No HOA
About This Home
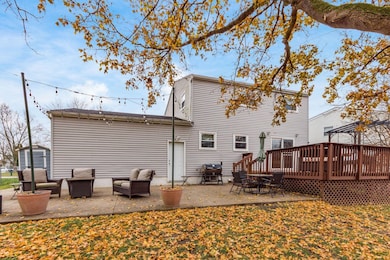
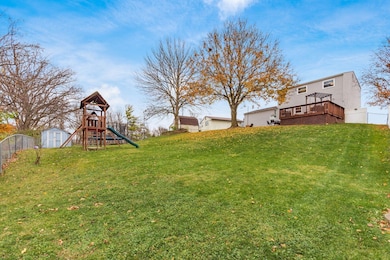
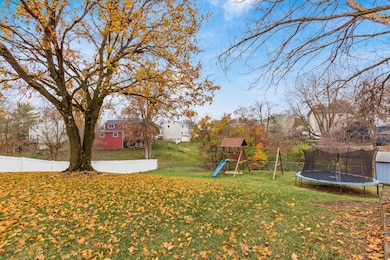
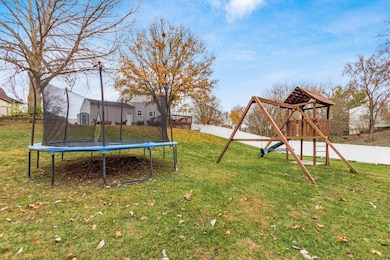
Charming 4-Bedroom Home in Lake Darby Estates -Welcome to this inviting 2-story home located in the desirable Lake Darby Estates community, offering the perfect blend of comfort, convenience, and outdoor space. Situated within the highly rated Hilliard School District, this well-maintained property features 4 bedrooms, 1 full bath, and 1 half bath across a smart, functional layout. The home includes approximately 1,300 sq. ft. of living space plus a finished basement, ideal for a family room, home office, or play area. Enjoy the outdoors in the large fenced-in backyard, complete with a spacious deck & Shed. This is perfect for relaxing, entertaining, or gatherings.
A wonderful opportunity to own a well-cared-for home in a sought-after neighborhood—don't miss it!
Home Details
Home Type
- Single Family
Est. Annual Taxes
- $5,824
Year Built
- Built in 1976
Lot Details
- 9,148 Sq Ft Lot
- Fenced Yard
Parking
- 2 Car Attached Garage
- Garage Door Opener
- Off-Street Parking: 3
Home Design
- Traditional Architecture
- Brick Exterior Construction
- Block Foundation
- Vinyl Siding
Interior Spaces
- 1,300 Sq Ft Home
- 2-Story Property
- Insulated Windows
- Home Security System
- Laundry on lower level
Kitchen
- Electric Range
- Dishwasher
Flooring
- Wood
- Carpet
- Laminate
- Vinyl
Bedrooms and Bathrooms
- 4 Bedrooms
Basement
- Basement Fills Entire Space Under The House
- Recreation or Family Area in Basement
Outdoor Features
- Deck
- Patio
Utilities
- Forced Air Heating and Cooling System
- Water Filtration System
Community Details
- No Home Owners Association
Listing and Financial Details
- Assessor Parcel Number 241-000464
Map
Home Values in the Area
Average Home Value in this Area
Tax History
| Year | Tax Paid | Tax Assessment Tax Assessment Total Assessment is a certain percentage of the fair market value that is determined by local assessors to be the total taxable value of land and additions on the property. | Land | Improvement |
|---|---|---|---|---|
| 2024 | $5,824 | $89,120 | $24,330 | $64,790 |
| 2023 | $5,028 | $89,110 | $24,325 | $64,785 |
| 2022 | $3,838 | $51,840 | $17,220 | $34,620 |
| 2021 | $3,835 | $51,840 | $17,220 | $34,620 |
| 2020 | $3,839 | $51,840 | $17,220 | $34,620 |
| 2019 | $3,767 | $43,300 | $14,350 | $28,950 |
| 2018 | $3,618 | $43,300 | $14,350 | $28,950 |
| 2017 | $3,596 | $43,300 | $14,350 | $28,950 |
| 2016 | $3,676 | $40,750 | $8,790 | $31,960 |
| 2015 | $3,479 | $40,750 | $8,790 | $31,960 |
| 2014 | $3,384 | $40,050 | $8,790 | $31,260 |
| 2013 | $1,823 | $42,140 | $9,240 | $32,900 |
Property History
| Date | Event | Price | List to Sale | Price per Sq Ft |
|---|---|---|---|---|
| 11/22/2025 11/22/25 | For Sale | $299,900 | -- | $231 / Sq Ft |
Purchase History
| Date | Type | Sale Price | Title Company |
|---|---|---|---|
| Interfamily Deed Transfer | -- | None Available | |
| Warranty Deed | $124,500 | Pritsolas T | |
| Deed | $66,000 | -- |
Mortgage History
| Date | Status | Loan Amount | Loan Type |
|---|---|---|---|
| Open | $147,028 | FHA | |
| Closed | $122,244 | FHA |
Source: Columbus and Central Ohio Regional MLS
MLS Number: 225043915
APN: 241-000464
Disclaimer: Certain information contained herein is derived from information provided by parties other than Homes.com. All information provided is deemed reliable, but is not guaranteed to be accurate and should be independently verified.
![]() IDX information is provided exclusively for personal, non-commercial use, and may not be used for any purpose other than to identify prospective properties consumers may be interested in purchasing.
IDX information is provided exclusively for personal, non-commercial use, and may not be used for any purpose other than to identify prospective properties consumers may be interested in purchasing.
Information is deemed reliable but not guaranteed.
- 749 Hubbard Rd
- 8642 Fairbrook Ave
- 8520 Cadence Dr
- 756 Infantry Dr
- 287 Greenlake St
- 8333 Squad Dr
- 1280 Four Star Dr W
- 8548 Canyon Cove Rd
- 8482 Dover Crest Ct
- 1278 Lieutenant Dr
- 8489 Dovercrest Ct
- 0 Dellinger Rd Unit 9 2030113
- 70 Riverside Dr
- 9519 High Free Pike
- 360 State Route 142 NE
- 10763 Southwood Rd
- 8290 Roberts Rd
- 0 Middle Pike Unit 225041650
- 74 S Chester St
- 63 Jones St
- 429 Red Elderberry Dr
- 98 N Franklin St
- 20 Eastgate Ave W
- 809 Dozer Dr
- 1745 Sledge Dr
- 280 Alton Darby Creek Rd
- 5997 Stillponds Place
- 1087 Wexford Green Blvd
- 270 Cloverhill Dr
- 5930 W Broad St
- 5911 Vero Dr
- 1100 Burnham Dr
- 1395 Ithaca Dr
- 121 Welshmore Dr
- 5766 Wellbrid Dr
- 5536 Cedar Springs Unit 5536A
- 5688 Battle Creek Way
- 395 Belfair Dr
- 5754 Wooden Plank Rd
- 5400 Diamond Loch
