8830 Kelburn Ave Spring Valley, CA 91977
Estimated Value: $629,000 - $765,000
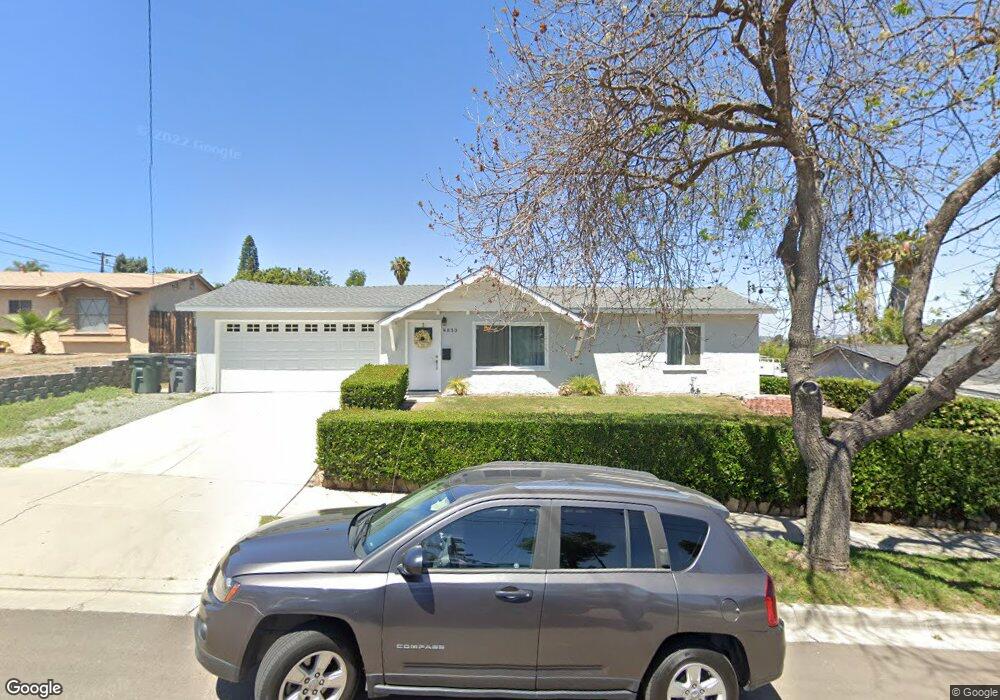
About This Home
This home is located at 8830 Kelburn Ave, Spring Valley, CA 91977 and is currently estimated at $712,198, approximately $657 per square foot. 8830 Kelburn Ave is a home located in San Diego County with nearby schools including Rancho Elementary School, Science, Technology, Engineering, Arts, And Math Academy, and Mount Miguel High School.
Ownership History
Purchase Details
Home Financials for this Owner
Home Financials are based on the most recent Mortgage that was taken out on this home.Purchase Details
Purchase Details
Home Financials for this Owner
Home Financials are based on the most recent Mortgage that was taken out on this home.Purchase Details
Purchase Details
Home Values in the Area
Average Home Value in this Area
Purchase History
We collect this data history from publicly available records. To have your information removed, we recommend requesting removal directly through your county’s website.
| Date | Buyer | Sale Price | Title Company |
|---|---|---|---|
| Chavarria Jose David Diaz | $455,000 | Ticor Tile Company Of Ca San | |
| Mac Capital Llc | $303,000 | Ticor Title | |
| Rivera Ramon | $134,500 | Chicago Title Ins Co | |
| Gilmore Mary J | -- | -- | |
| -- | $111,000 | -- |
Mortgage History
We collect this data history from publicly available records. To have your information removed, we recommend requesting removal directly through your county’s website.
| Date | Status | Borrower | Loan Amount |
|---|---|---|---|
| Open | Chavarria Jose David Diaz | $455,000 | |
| Previous Owner | Rivera Ramon | $133,400 |
Tax History
| Year | Tax Paid | Tax Assessment Tax Assessment Total Assessment is a certain percentage of the fair market value that is determined by local assessors to be the total taxable value of land and additions on the property. | Land | Improvement |
|---|---|---|---|---|
| 2025 | $6,393 | $507,555 | $379,272 | $128,283 |
| 2024 | $6,393 | $497,604 | $371,836 | $125,768 |
| 2023 | $6,175 | $487,848 | $364,546 | $123,302 |
| 2022 | $6,082 | $478,284 | $357,399 | $120,885 |
| 2021 | $6,021 | $468,907 | $350,392 | $118,515 |
| 2020 | $5,783 | $464,100 | $346,800 | $117,300 |
| 2019 | $5,699 | $455,000 | $340,000 | $115,000 |
| 2018 | $2,474 | $181,666 | $87,795 | $93,871 |
| 2017 | $2,399 | $178,105 | $86,074 | $92,031 |
| 2016 | $2,302 | $174,614 | $84,387 | $90,227 |
| 2015 | $2,281 | $171,992 | $83,120 | $88,872 |
| 2014 | $2,248 | $168,624 | $81,492 | $87,132 |
Map
- 738 Carlsbad St
- 709 Worthington St
- 8828 Hillslope Ave
- 753 Elkelton Blvd
- 835 Worthington St
- 8820 Ellenwood Cir
- 720 Safford Ave
- 8740 Adriana St
- 641 Billow Dr
- 8535 Paradise Valley Rd Unit 4
- 8766 Kelso St
- 910 Saint George Ct
- 901 Saint George Ct
- 8936 Orville St
- 1040 Gillespie Dr
- 9011 Joan St
- 425 S Meadowbrook Dr Unit 124
- 8840 Leigh Ave Unit 12
- 8170 Paradise Valley Ct
- 8034 Skyline Dr
- 8817 Kelburn Ave
- 8829 Kelburn Ave
- 8826 Lance Ave
- 8820 Lance Ave
- 8832 Lance Ave
- 8835 Kelburn Ave
- 8811 Kelburn Ave
- 8824 Kelburn Ave
- 8818 Kelburn Ave
- 8814 Lance Ave
- 8838 Lance Ave
- 8812 Kelburn Ave
- 8841 Kelburn Ave
- 8836 Kelburn Ave
- 8844 Lance Ave
- 701 Carlsbad St
- 731 Carlsbad St
- 713 Carlsbad St
- 8821 Jaylee Ave
- 8815 Jaylee Ave
Ask me questions while you tour the home.