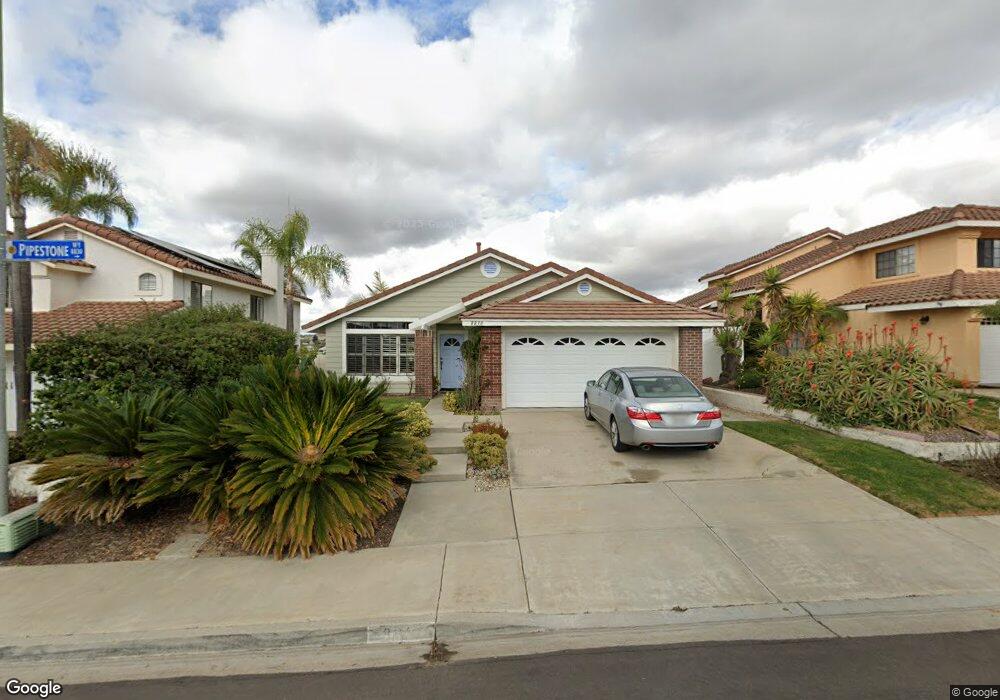
8830 Pipestone Way San Diego, CA 92129
Rancho Peñasquitos NeighborhoodEstimated Value: $1,323,718 - $1,503,000
3
Beds
2
Baths
1,549
Sq Ft
$925/Sq Ft
Est. Value
About This Home
This home is located at 8830 Pipestone Way, San Diego, CA 92129 and is currently estimated at $1,432,430, approximately $924 per square foot. 8830 Pipestone Way is a home located in San Diego County with nearby schools including Deer Canyon Elementary School, Mesa Verde Middle School, and Westview High School.
Ownership History
Date
Name
Owned For
Owner Type
Purchase Details
Closed on
May 26, 2009
Sold by
Brink Barbara B
Bought by
Brink Barbara B
Current Estimated Value
Purchase Details
Closed on
Apr 5, 2007
Sold by
Sievers Werner R and Sievers Petronella
Bought by
Brink Barbara B
Home Financials for this Owner
Home Financials are based on the most recent Mortgage that was taken out on this home.
Original Mortgage
$186,000
Outstanding Balance
$112,213
Interest Rate
6.11%
Mortgage Type
Unknown
Estimated Equity
$1,320,217
Purchase Details
Closed on
Oct 12, 2005
Sold by
Riley John G and Riley Shirley
Bought by
Sievers Werner R and Sievers Petronella
Home Financials for this Owner
Home Financials are based on the most recent Mortgage that was taken out on this home.
Original Mortgage
$345,000
Interest Rate
5.68%
Mortgage Type
New Conventional
Purchase Details
Closed on
Oct 31, 1988
Create a Home Valuation Report for This Property
The Home Valuation Report is an in-depth analysis detailing your home's value as well as a comparison with similar homes in the area
Home Values in the Area
Average Home Value in this Area
Purchase History
| Date | Buyer | Sale Price | Title Company |
|---|---|---|---|
| Brink Barbara B | -- | None Available | |
| Brink Barbara B | $635,000 | Old Republic Title Company | |
| Sievers Werner R | $595,000 | Commonwealth Title | |
| -- | $180,000 | -- |
Source: Public Records
Mortgage History
| Date | Status | Borrower | Loan Amount |
|---|---|---|---|
| Open | Brink Barbara B | $186,000 | |
| Previous Owner | Sievers Werner R | $345,000 |
Source: Public Records
Tax History Compared to Growth
Tax History
| Year | Tax Paid | Tax Assessment Tax Assessment Total Assessment is a certain percentage of the fair market value that is determined by local assessors to be the total taxable value of land and additions on the property. | Land | Improvement |
|---|---|---|---|---|
| 2025 | $8,573 | $850,706 | $468,894 | $381,812 |
| 2024 | $8,573 | $834,026 | $459,700 | $374,326 |
| 2023 | $8,378 | $817,674 | $450,687 | $366,987 |
| 2022 | $8,220 | $801,642 | $441,850 | $359,792 |
| 2021 | $7,486 | $730,000 | $373,000 | $357,000 |
| 2020 | $6,982 | $680,000 | $348,000 | $332,000 |
| 2019 | $6,986 | $680,000 | $348,000 | $332,000 |
| 2018 | $6,671 | $650,000 | $333,000 | $317,000 |
| 2017 | $82 | $620,000 | $318,000 | $302,000 |
| 2016 | $6,133 | $600,000 | $308,000 | $292,000 |
| 2015 | $6,133 | $600,000 | $308,000 | $292,000 |
| 2014 | $5,850 | $575,000 | $296,000 | $279,000 |
Source: Public Records
Map
Nearby Homes
- 8730 Twin Trails Dr
- 8862 La Cartera St
- 13907 Bruyere Ct
- 13559 Chaco Ct
- 14305 El Vestido St
- 9120 Meadowrun Place
- 9360 Stargaze Ave
- 14442 Calle Nublado
- 9151 Emden Rd
- 13146 Thunderhead St
- 13445 Appalachian Way
- 8183 Doug Hill
- 13411 Appalachian Way
- 13640 Via Cima Bella
- 12740 Prairie Dog Ave
- 12880 War Horse St
- 7795 Sendero Angelica
- 9555 Via Pereza
- 9302 Twin Trails Dr Unit 204
- 7855 Via Belfiore Unit 1
- 8834 Pipestone Way
- 8826 Pipestone Way
- 8822 Pipestone Way
- 8838 Pipestone Way Unit 1
- 8945 Rotherham Ave
- 8935 Rotherham Ave
- 8925 Rotherham Ave
- 8816 Pipestone Way
- 8842 Pipestone Way
- 8955 Rotherham Ave
- 13945 Gunnison Ct
- 8915 Rotherham Ave
- 13940 Gunnison Ct
- 8810 Pipestone Way
- 13847 Sparren Ave
- 8848 Pipestone Way
- 13933 Gunnison Ct Unit 1
- 8859 Pipestone Way
- 13932 Gunnison Ct
- 13795 Sparren Ave