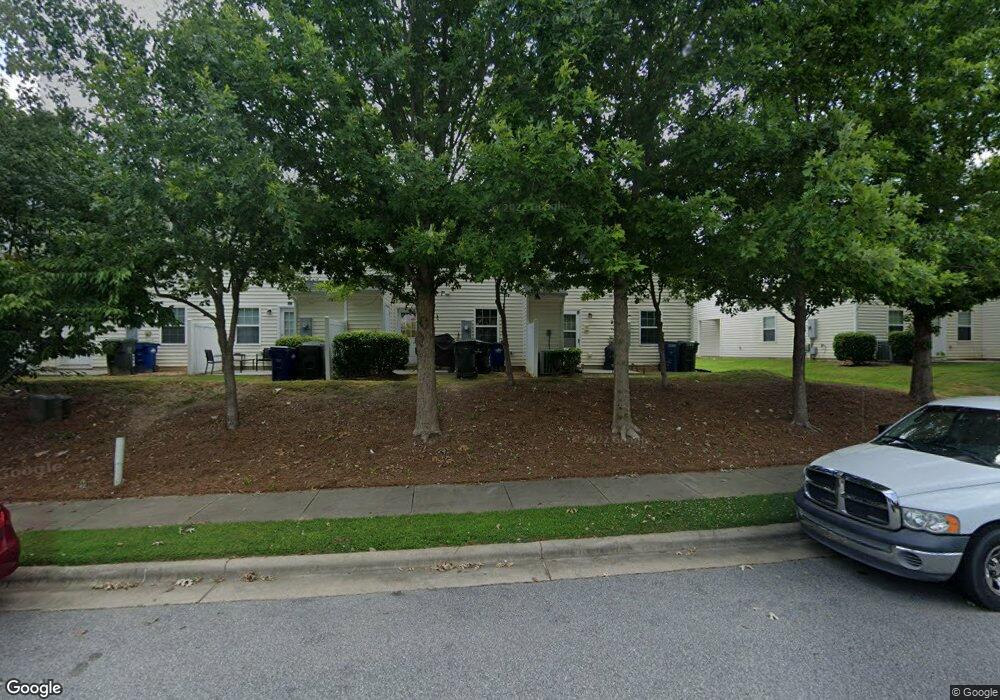
8832 Thornton Garden Ln Raleigh, NC 27616
Forestville NeighborhoodEstimated Value: $254,000 - $282,000
3
Beds
3
Baths
1,360
Sq Ft
$194/Sq Ft
Est. Value
About This Home
This home is located at 8832 Thornton Garden Ln, Raleigh, NC 27616 and is currently estimated at $263,690, approximately $193 per square foot. 8832 Thornton Garden Ln is a home located in Wake County with nearby schools including Wildwood Forest Elementary, East Millbrook Middle, and Wakefield High School.
Ownership History
Date
Name
Owned For
Owner Type
Purchase Details
Closed on
Apr 6, 2010
Sold by
Federal National Mortgage Association
Bought by
Cooke Ii Ronald E
Current Estimated Value
Home Financials for this Owner
Home Financials are based on the most recent Mortgage that was taken out on this home.
Original Mortgage
$113,960
Outstanding Balance
$75,864
Interest Rate
4.99%
Mortgage Type
FHA
Estimated Equity
$187,826
Purchase Details
Closed on
Oct 2, 2009
Sold by
Trinh Vu Frank T
Bought by
Federal National Mortgage Association
Purchase Details
Closed on
May 1, 2007
Sold by
Anderson Homes Inc
Bought by
Trinh Vu Frank T
Home Financials for this Owner
Home Financials are based on the most recent Mortgage that was taken out on this home.
Original Mortgage
$131,180
Interest Rate
6.17%
Mortgage Type
Unknown
Purchase Details
Closed on
Sep 29, 2006
Sold by
Puckett Bynum Development Llc
Bought by
Anderson Homes Inc
Create a Home Valuation Report for This Property
The Home Valuation Report is an in-depth analysis detailing your home's value as well as a comparison with similar homes in the area
Home Values in the Area
Average Home Value in this Area
Purchase History
| Date | Buyer | Sale Price | Title Company |
|---|---|---|---|
| Cooke Ii Ronald E | -- | None Available | |
| Federal National Mortgage Association | $119,934 | None Available | |
| Trinh Vu Frank T | $131,500 | None Available | |
| Anderson Homes Inc | $125,000 | None Available |
Source: Public Records
Mortgage History
| Date | Status | Borrower | Loan Amount |
|---|---|---|---|
| Open | Cooke Ii Ronald E | $113,960 | |
| Previous Owner | Trinh Vu Frank T | $131,180 |
Source: Public Records
Tax History Compared to Growth
Tax History
| Year | Tax Paid | Tax Assessment Tax Assessment Total Assessment is a certain percentage of the fair market value that is determined by local assessors to be the total taxable value of land and additions on the property. | Land | Improvement |
|---|---|---|---|---|
| 2025 | $2,339 | $265,918 | $65,000 | $200,918 |
| 2024 | $2,330 | $265,918 | $65,000 | $200,918 |
| 2023 | $1,751 | $158,784 | $35,000 | $123,784 |
| 2022 | $1,628 | $158,784 | $35,000 | $123,784 |
| 2021 | $1,565 | $158,784 | $35,000 | $123,784 |
| 2020 | $1,537 | $158,784 | $35,000 | $123,784 |
| 2019 | $1,546 | $131,704 | $26,000 | $105,704 |
| 2018 | $1,459 | $131,704 | $26,000 | $105,704 |
| 2017 | $1,390 | $131,704 | $26,000 | $105,704 |
| 2016 | $1,362 | $131,704 | $26,000 | $105,704 |
| 2015 | $1,353 | $128,746 | $26,000 | $102,746 |
| 2014 | $1,284 | $128,746 | $26,000 | $102,746 |
Source: Public Records
Map
Nearby Homes
- 8911 Elizabeth Benneth Place
- 5126 Thornton Knoll Way
- 8857 Thornton Town Place
- 8947 Commons Townes Dr
- 5163 Sandy Banks Rd
- 8957 Commons Townes Dr
- 5107 Sandy Banks Rd
- 8885 Commons Townes Dr
- 5121 Neuse Commons Ln
- 8707 River Keeper Way
- 8640 Neuse Landing Ln Unit 110
- 8610 Neuse Landing Ln Unit 103
- 8620 Neuse Club Ln Unit 111
- 8620 Neuse Club Ln Unit 107
- SYDNEY Plan at Thornton Townes
- JONATHAN Plan at Thornton Townes
- 5309 Neuse Wood Dr
- 8702 Neuse Town Dr
- 4821 Gossamer Ln Unit 103
- 4821 Gossamer Ln Unit 102
- 8830 Thornton Garden Ln
- 8834 Thornton Garden Ln
- 8828 Thornton Garden Ln
- 8826 Thornton Garden Ln
- 8838 Thornton Garden Ln
- 8824 Thornton Garden Ln
- 8824 Thornton Garden Ln Unit 49
- 8840 Thornton Garden Ln
- 8822 Thornton Garden Ln
- 8842 Thornton Garden Ln
- 8835 Thornton Garden Ln
- 8820 Thornton Garden Ln
- 8829 Thornton Garden Ln
- 8844 Thornton Garden Ln
- 8837 Thornton Garden Ln
- 8827 Thornton Garden Ln
- 8867 Elizabeth Bennet Piace
- 8839 Thornton Garden Ln
- 8825 Thornton Garden Ln
- 8859 Elizabeth Bennet Place