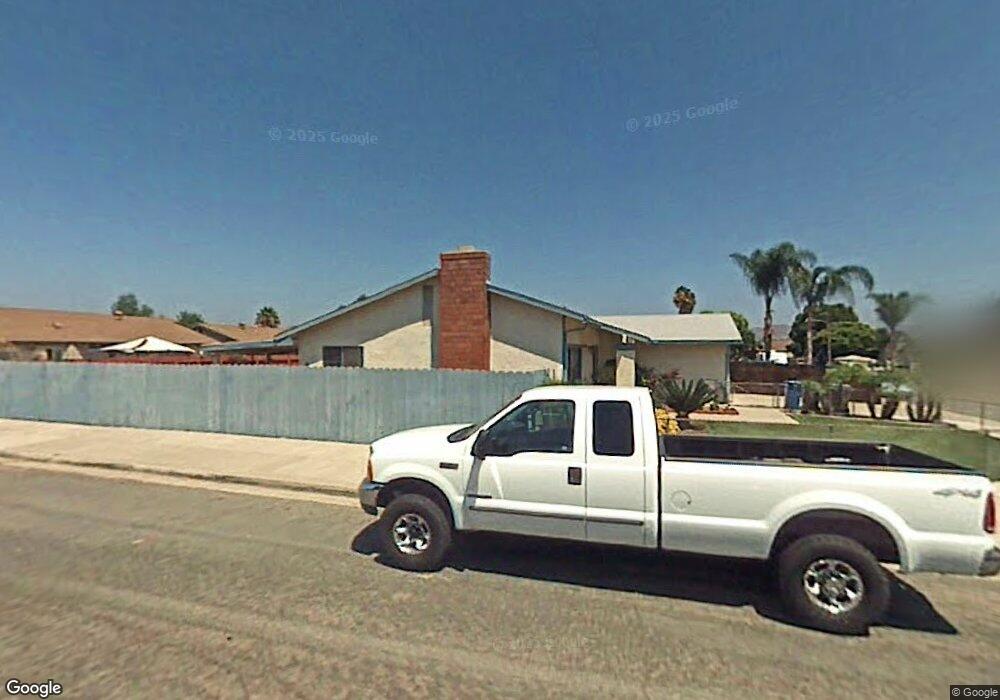
8833 Ellsworth Cir Santee, CA 92071
Estimated Value: $780,000 - $814,000
3
Beds
2
Baths
1,624
Sq Ft
$490/Sq Ft
Est. Value
About This Home
This home is located at 8833 Ellsworth Cir, Santee, CA 92071 and is currently estimated at $795,634, approximately $489 per square foot. 8833 Ellsworth Cir is a home located in San Diego County with nearby schools including Pride Academy At Prospect Avenue and West Hills High School.
Ownership History
Date
Name
Owned For
Owner Type
Purchase Details
Closed on
Sep 24, 2024
Sold by
Clark Michael J and Clark Jenna L
Bought by
Michael And Jenna Clark Revocable Trust and Clark
Current Estimated Value
Purchase Details
Closed on
Aug 4, 2016
Sold by
Schwartz Scott C and Clark Jenna Lee
Bought by
Clark Jenna L
Home Financials for this Owner
Home Financials are based on the most recent Mortgage that was taken out on this home.
Original Mortgage
$294,700
Interest Rate
3.42%
Mortgage Type
New Conventional
Purchase Details
Closed on
Apr 7, 2011
Sold by
Williams Carol
Bought by
Schwartz Scott C and Bruso Jenna Lee
Home Financials for this Owner
Home Financials are based on the most recent Mortgage that was taken out on this home.
Original Mortgage
$227,250
Interest Rate
4.45%
Mortgage Type
FHA
Purchase Details
Closed on
Feb 18, 1997
Sold by
Nicholas Ferrari
Bought by
Ferrari Nicholas
Create a Home Valuation Report for This Property
The Home Valuation Report is an in-depth analysis detailing your home's value as well as a comparison with similar homes in the area
Purchase History
| Date | Buyer | Sale Price | Title Company |
|---|---|---|---|
| Michael And Jenna Clark Revocable Trust | -- | None Listed On Document | |
| Clark Jenna L | -- | First American Title | |
| Schwartz Scott C | $250,000 | Ticor Title San Diego Branch | |
| Ferrari Nicholas | -- | -- |
Source: Public Records
Mortgage History
| Date | Status | Borrower | Loan Amount |
|---|---|---|---|
| Previous Owner | Clark Jenna L | $294,700 | |
| Previous Owner | Schwartz Scott C | $227,250 |
Source: Public Records
Tax History
| Year | Tax Paid | Tax Assessment Tax Assessment Total Assessment is a certain percentage of the fair market value that is determined by local assessors to be the total taxable value of land and additions on the property. | Land | Improvement |
|---|---|---|---|---|
| 2025 | $5,663 | $474,789 | $160,193 | $314,596 |
| 2024 | $5,663 | $465,480 | $157,052 | $308,428 |
| 2023 | $5,490 | $456,354 | $153,973 | $302,381 |
| 2022 | $5,451 | $447,406 | $150,954 | $296,452 |
| 2021 | $5,376 | $438,635 | $147,995 | $290,640 |
| 2020 | $5,310 | $434,138 | $146,478 | $287,660 |
| 2019 | $5,124 | $425,626 | $143,606 | $282,020 |
| 2018 | $5,019 | $417,282 | $140,791 | $276,491 |
| 2017 | $4,615 | $380,278 | $138,031 | $242,247 |
| 2016 | $3,224 | $265,255 | $103,984 | $161,271 |
| 2015 | $3,181 | $261,272 | $102,423 | $158,849 |
| 2014 | $3,118 | $256,155 | $100,417 | $155,738 |
Source: Public Records
Map
Nearby Homes
- 9219 Via de Amor
- 9428 Prospect Ave
- 8772 Glen Vista Way
- 8632 Atlas View Dr
- 9459 Mission Gorge Rd Unit 121
- 9449 Prospect Ave
- 8653 Willow Terrace
- 0000 Prospect Ave
- 8420 Fanita Dr Unit 3
- 9048 Willowgrove Place
- 8513 Placid View Dr
- 8535 Placid View Dr
- 9211 Todos Santos Dr
- 8515 Placid View Dr
- 9144 Fanita Rancho Rd
- 8672 Camden Dr
- 8952 Fletcher Valley Dr
- 8612 Arminda Cir Unit 51
- 9401 Carlton Oaks Dr Unit E
- 8633 Amherst St
- 8827 Ellsworth Cir
- 8733 Ellsworth Cir
- 8739 Ellsworth Cir
- 8823 Ellsworth Cir
- 8854 Ellsworth Cir
- 8830 Ellsworth Cir
- 8743 Ellsworth Cir
- 8844 Ellsworth Cir
- 8824 Ellsworth Cir
- 8834 Ellsworth Cir
- 8860 Ellsworth Cir
- 8817 Ellsworth Cir
- 8840 Ellsworth Cir
- 8820 Ellsworth Cir
- 8749 Ellsworth Cir
- 9312 Prospect Ave
- 8864 Ellsworth Cir
- 8730 Ellsworth Cir
- 8813 Ellsworth Cir
- 8814 Ellsworth Cir
Your Personal Tour Guide
Ask me questions while you tour the home.