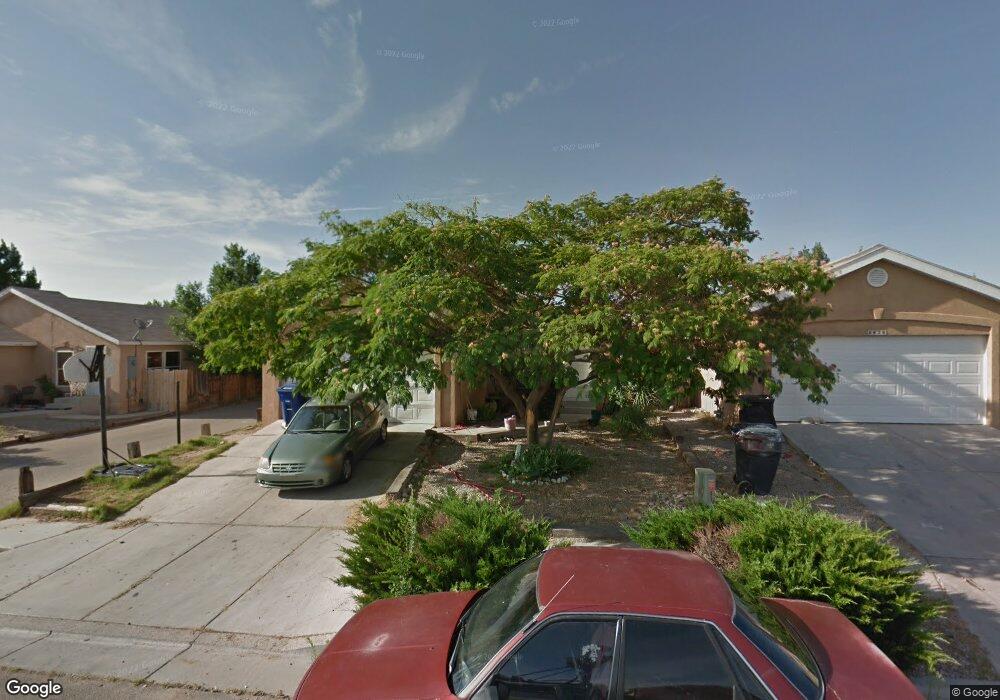
8834 Odin Rd SW Albuquerque, NM 87121
Southwest Heights NeighborhoodEstimated Value: $222,000 - $276,000
3
Beds
2
Baths
1,175
Sq Ft
$213/Sq Ft
Est. Value
About This Home
This home is located at 8834 Odin Rd SW, Albuquerque, NM 87121 and is currently estimated at $249,756, approximately $212 per square foot. 8834 Odin Rd SW is a home located in Bernalillo County with nearby schools including Helen Cordero Primary School, Edward Gonzales Elementary School, and Jimmy Carter Middle School.
Ownership History
Date
Name
Owned For
Owner Type
Purchase Details
Closed on
Jun 30, 2022
Sold by
Bernalillo County Treasurer
Bought by
Arthur Sanchez
Current Estimated Value
Purchase Details
Closed on
Dec 15, 2006
Sold by
Sanchez Arthur and Sanchez Dora
Bought by
Sanchez Arthur and Sanchez Dora
Purchase Details
Closed on
Sep 23, 2006
Sold by
Otero Daniel and Otero Barbara
Bought by
Sanchez Arthur and Sanchez Dora
Purchase Details
Closed on
Aug 9, 2005
Sold by
Hud
Bought by
Otero Daniel R and Otero Barbara A
Purchase Details
Closed on
Jan 25, 2005
Sold by
Countrywide Home Loans Inc
Bought by
Hud
Purchase Details
Closed on
Aug 17, 1999
Sold by
Fleetwood Retail Corp Of New Mexico
Bought by
Gonzales Lawrence J and Gonzales Monica M
Home Financials for this Owner
Home Financials are based on the most recent Mortgage that was taken out on this home.
Original Mortgage
$94,749
Interest Rate
7.68%
Mortgage Type
FHA
Create a Home Valuation Report for This Property
The Home Valuation Report is an in-depth analysis detailing your home's value as well as a comparison with similar homes in the area
Home Values in the Area
Average Home Value in this Area
Purchase History
| Date | Buyer | Sale Price | Title Company |
|---|---|---|---|
| Arthur Sanchez | $1,319 | None Listed On Document | |
| Sanchez Arthur | -- | None Available | |
| Sanchez Arthur | -- | None Available | |
| Otero Daniel R | -- | Fidelity National Title Co | |
| Hud | -- | First American Title Ins Co | |
| Gonzales Lawrence J | -- | First American Title |
Source: Public Records
Mortgage History
| Date | Status | Borrower | Loan Amount |
|---|---|---|---|
| Previous Owner | Gonzales Lawrence J | $94,749 |
Source: Public Records
Tax History Compared to Growth
Tax History
| Year | Tax Paid | Tax Assessment Tax Assessment Total Assessment is a certain percentage of the fair market value that is determined by local assessors to be the total taxable value of land and additions on the property. | Land | Improvement |
|---|---|---|---|---|
| 2025 | $9,414 | $32,047 | $12,827 | $19,220 |
| 2024 | $9,414 | $31,114 | $12,454 | $18,660 |
| 2023 | $7,360 | $30,208 | $12,091 | $18,117 |
| 2022 | $1,247 | $29,329 | $11,739 | $17,590 |
| 2021 | $1,206 | $28,475 | $11,398 | $17,077 |
| 2020 | $1,186 | $27,646 | $11,066 | $16,580 |
| 2019 | $2,433 | $26,841 | $10,744 | $16,097 |
| 2018 | $1,110 | $26,841 | $10,744 | $16,097 |
| 2017 | $1,076 | $26,060 | $10,431 | $15,629 |
| 2016 | $1,045 | $24,564 | $9,832 | $14,732 |
| 2015 | $24,564 | $24,564 | $9,832 | $14,732 |
| 2014 | $1,050 | $24,731 | $9,832 | $14,899 |
| 2013 | -- | $28,370 | $7,387 | $20,983 |
Source: Public Records
Map
Nearby Homes
- 8709 Odin Rd SW
- 8700 Thor Rd SW
- 8900 La Vida Ln SW
- 8930 Thor Rd SW
- 519 Fenwick Place SW
- 9409 Desert Pine Ave SW
- 615 82nd St SW
- 8523 Vista Serena Ln SW
- 8308 Vista Chamisa Ln SW
- 427 Bluethorn Ct SW
- 537 Sky Tower St SW
- 527 Whisper Mesa St SW
- 9608 Water Stone Rd SW
- 424 Whitethorn St SW
- 575 94th St SW
- 9621 Central Ave NW Unit C
- 704 Nicklaus Dr SW
- 500 Hartman Dr SW
- 3525 Tower Rd SW
- 7612 Via Belleza SW
- 8838 Odin Rd SW
- 8818 Odin Rd SW
- 8842 Odin Rd SW Unit 1
- 8826 Odin Rd SW
- 8814 Odin Rd SW
- 8822 Odin Rd SW
- 8846 Odin Rd SW
- 8835 Odin Rd SW
- 8823 Odin Rd SW
- 8839 Odin Rd SW
- 8823 Thor Rd SW
- 8827 Thor Rd SW
- 8808 Odin Rd SW
- 8819 Thor Rd SW
- 8843 Odin Rd SW
- 8831 Thor Rd SW
- 8815 Odin Rd SW
- 8900 Odin Rd SW
- 8907 Thor Rd SW
- 8815 Thor Rd SW