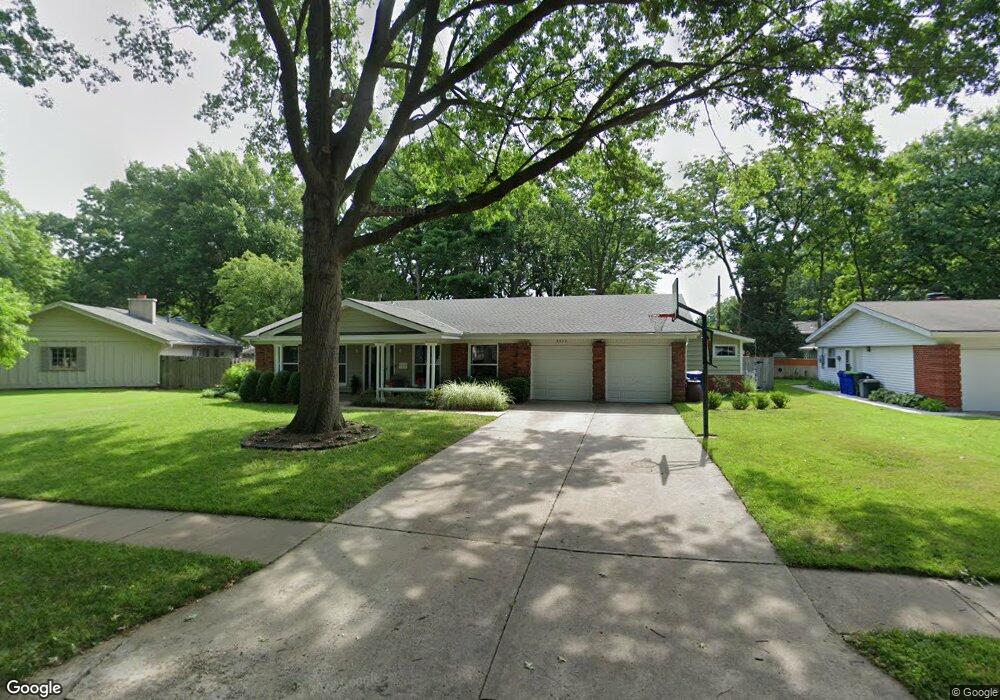
8839 Horton Dr Overland Park, KS 66207
Estimated Value: $450,126 - $549,000
4
Beds
2
Baths
1,909
Sq Ft
$253/Sq Ft
Est. Value
About This Home
This home is located at 8839 Horton Dr, Overland Park, KS 66207 and is currently estimated at $482,532, approximately $252 per square foot. 8839 Horton Dr is a home located in Johnson County with nearby schools including Briarwood Elementary School, Indian Hills Middle School, and Shawnee Mission East High School.
Ownership History
Date
Name
Owned For
Owner Type
Purchase Details
Closed on
Apr 14, 2023
Sold by
Bircher Dawn and Bircher Jason
Bought by
Bircher Dawn
Current Estimated Value
Purchase Details
Closed on
May 13, 2005
Sold by
Gans Ronald M
Bought by
Bircher Dawn T and Bircher Jason D
Home Financials for this Owner
Home Financials are based on the most recent Mortgage that was taken out on this home.
Original Mortgage
$32,992
Interest Rate
5.87%
Mortgage Type
Credit Line Revolving
Purchase Details
Closed on
Apr 11, 2005
Sold by
Gans Deborah D
Bought by
Gans Ronald M
Home Financials for this Owner
Home Financials are based on the most recent Mortgage that was taken out on this home.
Original Mortgage
$32,992
Interest Rate
5.87%
Mortgage Type
Credit Line Revolving
Create a Home Valuation Report for This Property
The Home Valuation Report is an in-depth analysis detailing your home's value as well as a comparison with similar homes in the area
Home Values in the Area
Average Home Value in this Area
Purchase History
| Date | Buyer | Sale Price | Title Company |
|---|---|---|---|
| Bircher Dawn | -- | None Listed On Document | |
| Bircher Dawn | -- | None Listed On Document | |
| Bircher Dawn T | -- | Chicago Title Ins Co | |
| Gans Ronald M | -- | None Available |
Source: Public Records
Mortgage History
| Date | Status | Borrower | Loan Amount |
|---|---|---|---|
| Previous Owner | Bircher Dawn T | $32,992 | |
| Previous Owner | Bircher Dawn T | $175,960 |
Source: Public Records
Tax History Compared to Growth
Tax History
| Year | Tax Paid | Tax Assessment Tax Assessment Total Assessment is a certain percentage of the fair market value that is determined by local assessors to be the total taxable value of land and additions on the property. | Land | Improvement |
|---|---|---|---|---|
| 2024 | $4,293 | $44,413 | $9,612 | $34,801 |
| 2023 | $3,892 | $39,756 | $9,573 | $30,183 |
| 2022 | $3,791 | $38,985 | $9,573 | $29,412 |
| 2021 | $3,657 | $35,799 | $8,329 | $27,470 |
| 2020 | $3,344 | $32,776 | $6,659 | $26,117 |
| 2019 | $3,204 | $31,441 | $5,126 | $26,315 |
| 2018 | $2,933 | $28,670 | $5,126 | $23,544 |
| 2017 | $2,830 | $27,209 | $5,126 | $22,083 |
| 2016 | $2,801 | $26,496 | $5,126 | $21,370 |
| 2015 | $2,609 | $25,185 | $5,126 | $20,059 |
| 2013 | -- | $24,001 | $5,126 | $18,875 |
Source: Public Records
Map
Nearby Homes
- 6201 W 86th Terrace
- 9100 Dearborn St
- 9015 Outlook Dr
- 9111 Walmer St
- 6116 W 85th Terrace
- 6108 W 85th Terrace
- 8932 Nall Ave
- 5516 W 87th Terrace
- 5615 W 91st St
- 6725 W 85th Terrace
- 9234 Woodson Dr
- 6600 W 93rd Terrace
- 9307 Woodson Dr
- 8331 Beverly Dr
- 8741 Marty St
- 5482 W 85th Terrace
- 8326 Maple Ln
- 4969 W 88th St
- 5911 W 94th Terrace
- 6118 W 95th St
- 8831 Horton Dr
- 8845 Horton Dr
- 6033 W 88th Terrace
- 6032 W 89th St
- 8838 Horton Dr
- 8844 Horton St
- 8844 Horton Dr
- 8830 Horton Dr
- 6025 W 88th Terrace
- 6024 W 89th St
- 8901 Horton Dr
- 8822 Horton St
- 6100 W 88th Terrace
- 8822 Horton Dr
- 6032 W 88th Terrace
- 6033 W 89th St
- 6017 W 88th Terrace
- 6016 W 89th St
- 8900 Horton Dr
- 8857 Lamar Ave