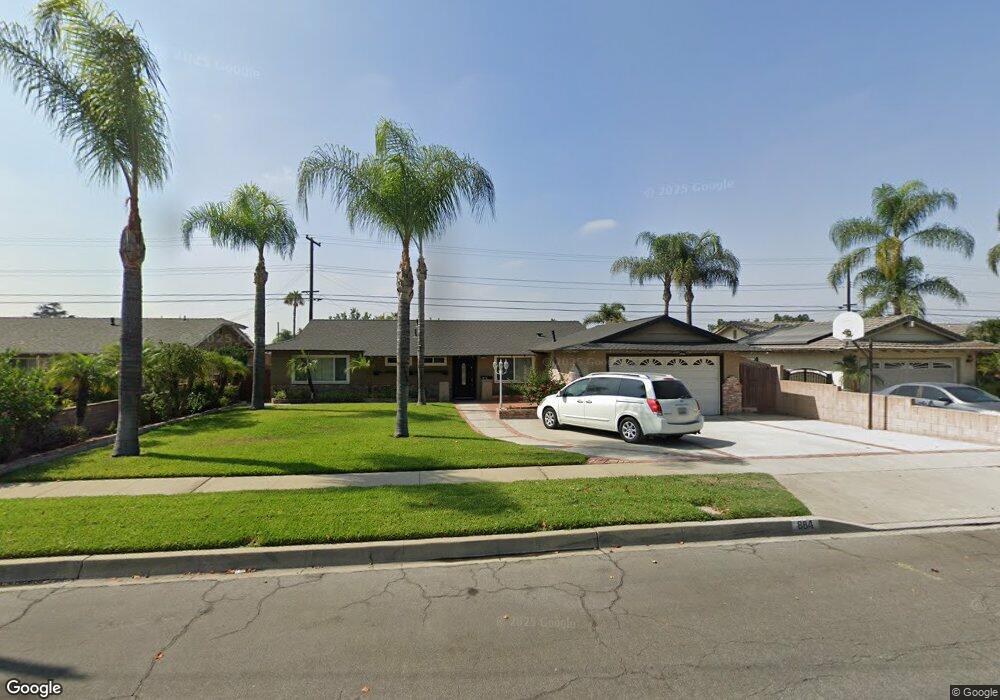
884 Azure Ct Upland, CA 91786
Estimated Value: $709,957 - $752,000
4
Beds
2
Baths
1,468
Sq Ft
$493/Sq Ft
Est. Value
About This Home
This home is located at 884 Azure Ct, Upland, CA 91786 and is currently estimated at $724,239, approximately $493 per square foot. 884 Azure Ct is a home located in San Bernardino County with nearby schools including Citrus Elementary, Upland Junior High School, and Upland High School.
Ownership History
Date
Name
Owned For
Owner Type
Purchase Details
Closed on
Mar 15, 2017
Sold by
Pisuraj Sineenad
Bought by
Pisuraj Sineenad and Pisuraj Charlie
Current Estimated Value
Home Financials for this Owner
Home Financials are based on the most recent Mortgage that was taken out on this home.
Original Mortgage
$200,000
Outstanding Balance
$165,851
Interest Rate
4.17%
Mortgage Type
New Conventional
Estimated Equity
$558,388
Purchase Details
Closed on
Jun 8, 2011
Sold by
Henn Dawn
Bought by
Pisuraj Sineenad
Purchase Details
Closed on
Mar 16, 2011
Sold by
Henn Terry
Bought by
Henn Dawn
Purchase Details
Closed on
Mar 12, 2011
Sold by
Fannie Mae
Bought by
Henn Dawn
Purchase Details
Closed on
May 3, 2010
Sold by
Carrillo Frank X and Carrillo Barbara J
Bought by
Federal National Mortgage Association
Create a Home Valuation Report for This Property
The Home Valuation Report is an in-depth analysis detailing your home's value as well as a comparison with similar homes in the area
Home Values in the Area
Average Home Value in this Area
Purchase History
| Date | Buyer | Sale Price | Title Company |
|---|---|---|---|
| Pisuraj Sineenad | -- | Spl Title Services | |
| Pisuraj Sineenad | $280,000 | Fidelity National Title Co | |
| Henn Dawn | -- | Old Republic Title Company | |
| Henn Dawn | $190,500 | Old Republic Title Company | |
| Federal National Mortgage Association | $240,524 | Accommodation |
Source: Public Records
Mortgage History
| Date | Status | Borrower | Loan Amount |
|---|---|---|---|
| Open | Pisuraj Sineenad | $200,000 |
Source: Public Records
Tax History Compared to Growth
Tax History
| Year | Tax Paid | Tax Assessment Tax Assessment Total Assessment is a certain percentage of the fair market value that is determined by local assessors to be the total taxable value of land and additions on the property. | Land | Improvement |
|---|---|---|---|---|
| 2025 | $3,853 | $358,727 | $121,712 | $237,015 |
| 2024 | $3,853 | $351,693 | $119,325 | $232,368 |
| 2023 | $3,793 | $344,797 | $116,985 | $227,812 |
| 2022 | $3,710 | $338,036 | $114,691 | $223,345 |
| 2021 | $3,702 | $331,408 | $112,442 | $218,966 |
| 2020 | $3,601 | $328,010 | $111,289 | $216,721 |
| 2019 | $3,588 | $321,579 | $109,107 | $212,472 |
| 2018 | $3,501 | $315,274 | $106,968 | $208,306 |
| 2017 | $3,399 | $309,093 | $104,871 | $204,222 |
| 2016 | $3,198 | $303,033 | $102,815 | $200,218 |
| 2015 | $3,124 | $298,482 | $101,271 | $197,211 |
| 2014 | $3,043 | $292,635 | $99,287 | $193,348 |
Source: Public Records
Map
Nearby Homes
- 371 S Alexander Ave
- 424 W 7th St
- 946 W La Deney Dr
- 384 W 7th St
- 822 W 5th St
- 945 W Bonnie Brae Ct
- 1242 N Cypress Ave
- 228 Greentree Rd
- 173 Elizabeth Ln
- 173 W 8th St
- 537 W 9th St
- 164 Euclid Place
- 345 S Euclid Ave
- 435 W 9th St Unit A6
- 435 W 9th St Unit F5
- 435 W 9th St Unit B3
- 321 Spencer Ave
- 1428 Fredericks Ln
- 1453 W 7th St Unit 24
- 1163 W Princeton St