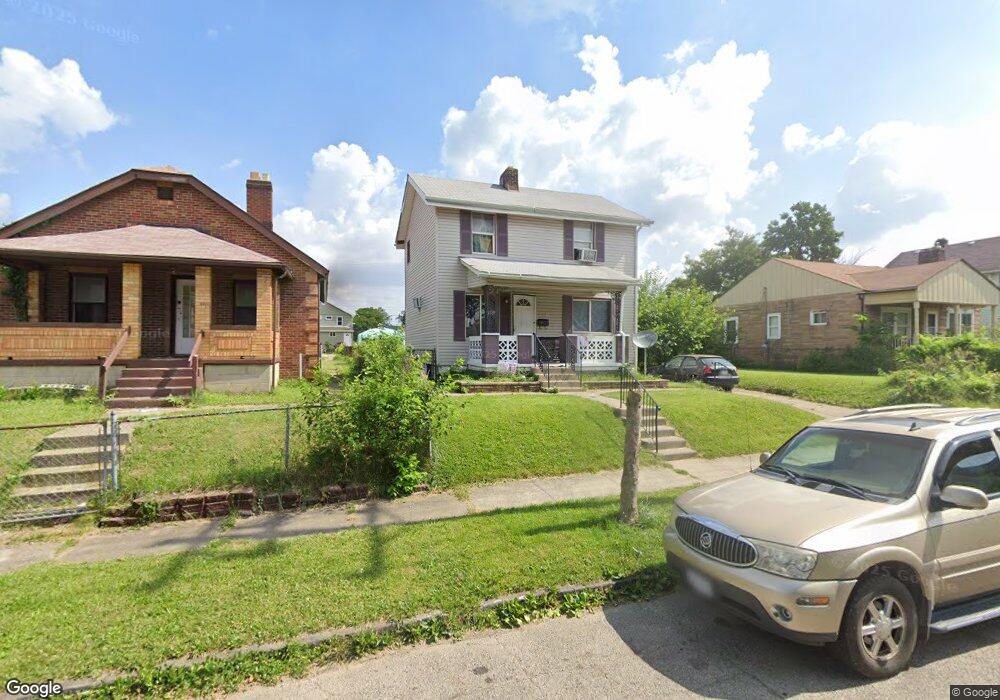
884 E 4th Ave Columbus, OH 43201
Milo-Grogan NeighborhoodEstimated Value: $138,206 - $185,000
3
Beds
1
Bath
1,008
Sq Ft
$158/Sq Ft
Est. Value
About This Home
This home is located at 884 E 4th Ave, Columbus, OH 43201 and is currently estimated at $159,552, approximately $158 per square foot. 884 E 4th Ave is a home located in Franklin County with nearby schools including Windsor Stem Acadmey, Linden-Mckinley Stem School On Arcadia, and Columbus Performance Academy.
Ownership History
Date
Name
Owned For
Owner Type
Purchase Details
Closed on
Jun 10, 2005
Sold by
Reid Denise E and Estate Of Leonard M Jackson
Bought by
Ross Jerome H
Current Estimated Value
Home Financials for this Owner
Home Financials are based on the most recent Mortgage that was taken out on this home.
Original Mortgage
$55,800
Interest Rate
5.75%
Mortgage Type
Fannie Mae Freddie Mac
Purchase Details
Closed on
Jun 8, 2005
Sold by
Jackson Leonard E
Bought by
Ross Jerome H
Home Financials for this Owner
Home Financials are based on the most recent Mortgage that was taken out on this home.
Original Mortgage
$55,800
Interest Rate
5.75%
Mortgage Type
Fannie Mae Freddie Mac
Purchase Details
Closed on
May 16, 2005
Sold by
Estate Of Sarah E Jackson
Bought by
Jackson Leonard M and Reid Denise E
Home Financials for this Owner
Home Financials are based on the most recent Mortgage that was taken out on this home.
Original Mortgage
$55,800
Interest Rate
5.75%
Mortgage Type
Fannie Mae Freddie Mac
Create a Home Valuation Report for This Property
The Home Valuation Report is an in-depth analysis detailing your home's value as well as a comparison with similar homes in the area
Home Values in the Area
Average Home Value in this Area
Purchase History
| Date | Buyer | Sale Price | Title Company |
|---|---|---|---|
| Ross Jerome H | $20,700 | -- | |
| Ross Jerome H | $20,700 | -- | |
| Ross Jerome H | $20,700 | -- | |
| Jackson Leonard M | -- | -- |
Source: Public Records
Mortgage History
| Date | Status | Borrower | Loan Amount |
|---|---|---|---|
| Previous Owner | Ross Jerome H | $55,800 |
Source: Public Records
Tax History
| Year | Tax Paid | Tax Assessment Tax Assessment Total Assessment is a certain percentage of the fair market value that is determined by local assessors to be the total taxable value of land and additions on the property. | Land | Improvement |
|---|---|---|---|---|
| 2025 | $1,756 | $35,040 | $5,220 | $29,820 |
| 2024 | $1,756 | $35,040 | $5,220 | $29,820 |
| 2023 | $1,736 | $35,040 | $5,220 | $29,820 |
| 2022 | $1,073 | $16,840 | $2,140 | $14,700 |
| 2021 | $1,222 | $16,840 | $2,140 | $14,700 |
| 2020 | $1,048 | $16,840 | $2,140 | $14,700 |
| 2019 | $1,039 | $14,290 | $1,860 | $12,430 |
| 2018 | $940 | $14,290 | $1,860 | $12,430 |
| 2017 | $938 | $14,290 | $1,860 | $12,430 |
| 2016 | $842 | $11,660 | $2,420 | $9,240 |
| 2015 | $797 | $11,660 | $2,420 | $9,240 |
| 2014 | $723 | $11,660 | $2,420 | $9,240 |
| 2013 | $489 | $12,950 | $2,695 | $10,255 |
Source: Public Records
Map
Nearby Homes
- 997-999 Gibbard Ave
- 780-782 Gibbard Ave
- 1025 Howard St
- 841 Saint Clair Ave
- 773-775 E 3rd Ave
- 927 Camden Ave
- 923 Camden Ave
- 650 E 3rd Ave
- 663 E 2nd Ave
- 276 E 4th Ave
- 0 Leona Ave
- 472 Reynolds Ave Unit 474
- 1449 Jefferson Ave
- 957 E 12th Ave
- 661 E 11th Ave
- 489 Saint Clair Ave
- 1463 Gibbard Ave
- 1538-1542 Accommodation Ave
- 1222 N Grant Ave Unit H
- 915 E 13th Ave
- 880 E 4th Ave
- 894 E 4th Ave
- 876 E 4th Ave
- 900 E 4th Ave Unit 902
- 887 E 5th Ave Unit 889
- 864 E 4th Ave
- 901 E 5th Ave
- 883 E 5th Ave
- 879 E 5th Ave
- 873 E 4th Ave
- 889 E 4th Ave
- 869 E 4th Ave
- 895 E 4th Ave Unit 897
- 869-871 E 5th Ave
- 869 E 5th Ave Unit 871
- 865 E 4th Ave
- 856 E 4th Ave
- 856 E 4th Ave
- 991 Saint Clair Ave
- 995 Saint Clair Ave
Your Personal Tour Guide
Ask me questions while you tour the home.