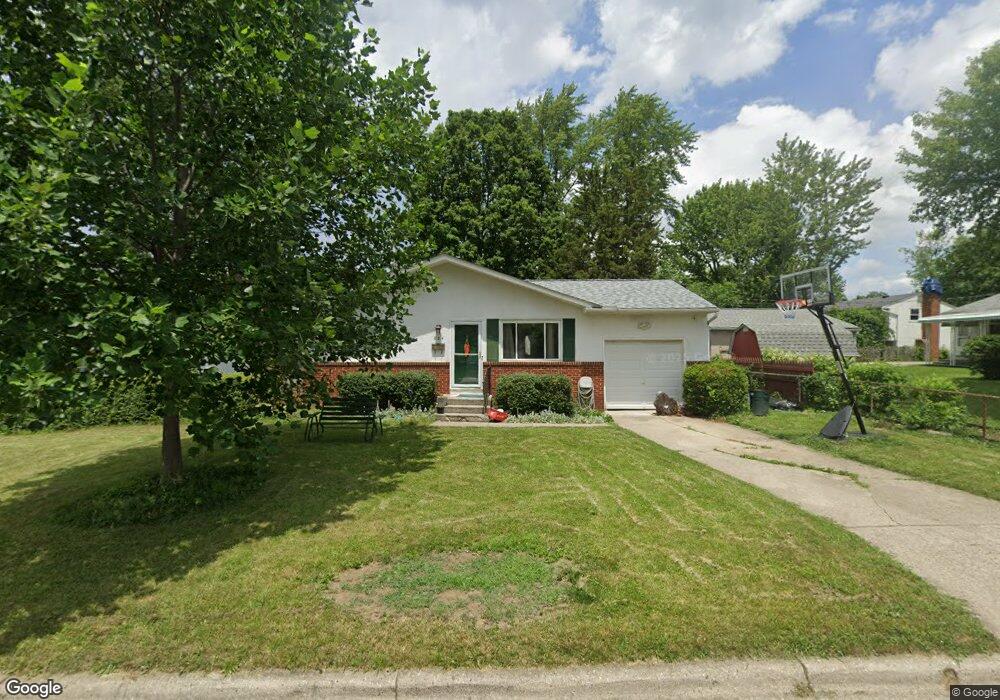
884 Sweeting Ave Columbus, OH 43229
Salem Village NeighborhoodEstimated Value: $249,649 - $276,000
3
Beds
1
Bath
1,058
Sq Ft
$243/Sq Ft
Est. Value
About This Home
This home is located at 884 Sweeting Ave, Columbus, OH 43229 and is currently estimated at $257,412, approximately $243 per square foot. 884 Sweeting Ave is a home located in Franklin County with nearby schools including Salem Elementary School, Dominion Middle School, and Whetstone High School.
Ownership History
Date
Name
Owned For
Owner Type
Purchase Details
Closed on
Mar 1, 2002
Sold by
Munhall Joseph G and Munhall Anna W
Bought by
Cooley Timothy J and Cooley Jane F
Current Estimated Value
Home Financials for this Owner
Home Financials are based on the most recent Mortgage that was taken out on this home.
Original Mortgage
$115,070
Outstanding Balance
$47,594
Interest Rate
6.92%
Mortgage Type
FHA
Estimated Equity
$209,818
Purchase Details
Closed on
Apr 9, 1996
Sold by
Cottrill Connie J
Bought by
Joseph G Munhall
Home Financials for this Owner
Home Financials are based on the most recent Mortgage that was taken out on this home.
Original Mortgage
$84,400
Interest Rate
7.36%
Mortgage Type
New Conventional
Purchase Details
Closed on
Sep 1, 1987
Create a Home Valuation Report for This Property
The Home Valuation Report is an in-depth analysis detailing your home's value as well as a comparison with similar homes in the area
Home Values in the Area
Average Home Value in this Area
Purchase History
| Date | Buyer | Sale Price | Title Company |
|---|---|---|---|
| Cooley Timothy J | $116,000 | Midland Celtic Title | |
| Joseph G Munhall | $88,900 | -- | |
| -- | $64,900 | -- |
Source: Public Records
Mortgage History
| Date | Status | Borrower | Loan Amount |
|---|---|---|---|
| Open | Cooley Timothy J | $115,070 | |
| Closed | Joseph G Munhall | $84,400 |
Source: Public Records
Tax History Compared to Growth
Tax History
| Year | Tax Paid | Tax Assessment Tax Assessment Total Assessment is a certain percentage of the fair market value that is determined by local assessors to be the total taxable value of land and additions on the property. | Land | Improvement |
|---|---|---|---|---|
| 2024 | $3,442 | $76,690 | $20,230 | $56,460 |
| 2023 | $3,398 | $76,685 | $20,230 | $56,455 |
| 2022 | $2,564 | $49,430 | $12,010 | $37,420 |
| 2021 | $2,568 | $49,430 | $12,010 | $37,420 |
| 2020 | $2,572 | $49,430 | $12,010 | $37,420 |
| 2019 | $2,289 | $37,730 | $9,240 | $28,490 |
| 2018 | $2,140 | $37,730 | $9,240 | $28,490 |
| 2017 | $2,243 | $37,730 | $9,240 | $28,490 |
| 2016 | $2,198 | $33,180 | $8,400 | $24,780 |
| 2015 | $1,995 | $33,180 | $8,400 | $24,780 |
| 2014 | $2,000 | $33,180 | $8,400 | $24,780 |
| 2013 | $1,021 | $34,335 | $8,855 | $25,480 |
Source: Public Records
Map
Nearby Homes
- 964 Strimple Ave
- 5475 Worthington Forest Pl E Unit 5475
- 5318 Eisenhower Rd
- 734 Worthington Forest Place Unit 734
- 627 S Selby Blvd
- 5462 Roche Dr
- 582 E Lincoln Ave
- 569 Chase Rd
- 5415 Vinewood Ct
- 5579 Norcross Rd
- 5548 Roche Dr
- 5480 Rockwood Ct Unit R1
- 4983 Almont Dr
- 5364 Sharon Ave
- 4904 Almont Dr
- 353 Kenbrook Dr
- 5674 Lindenwood Rd
- 1116 Tulsa Dr
- 415 E South St
- 1385 Thurell Rd
- 5351 Crawford Dr
- 5361 Crawford Dr
- 868 Sweeting Ave
- 881 E Lincoln Ave
- 881 E Lincoln Ave
- 875 E Lincoln Ave
- 889 E Lincoln Ave
- 889 E Lincoln Ave
- 862 Sweeting Ave
- 869 E Lincoln Ave
- 873 E Lincoln Ave
- 865 E Lincoln Ave
- 895 E Lincoln Ave
- 875 Sweeting Ave
- 857 E Lincoln Ave
- 849 E Lincoln Ave
- 861 E Lincoln Ave
- 865 Sweeting Ave
- 5327 Crawford Dr
- 854 Sweeting Ave