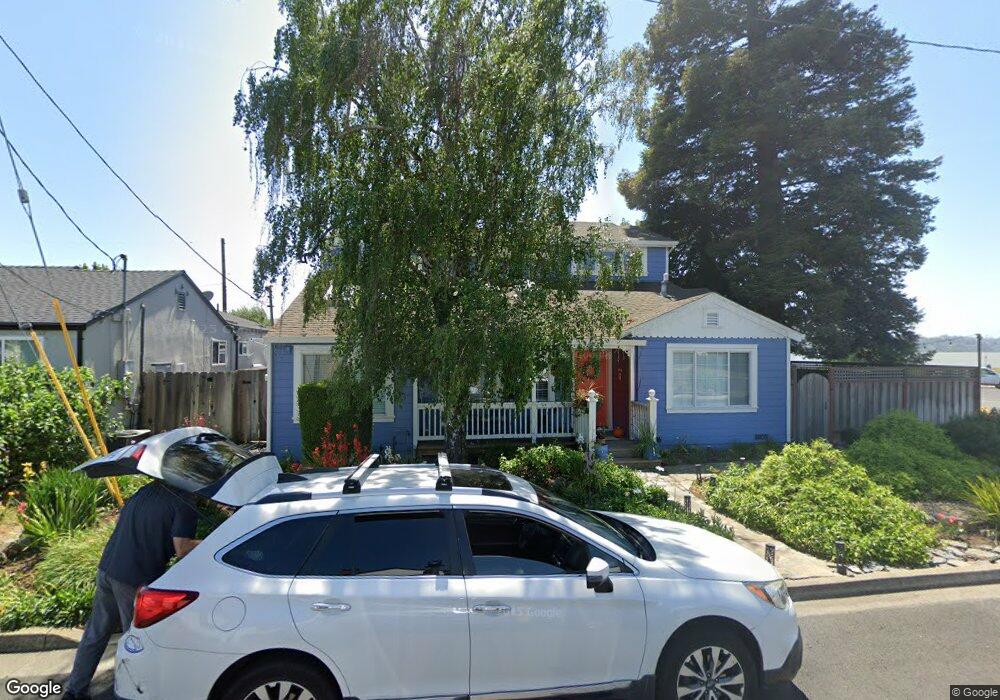
884 Wainwright St Benicia, CA 94510
Estimated Value: $971,489 - $1,195,000
3
Beds
3
Baths
2,401
Sq Ft
$450/Sq Ft
Est. Value
About This Home
This home is located at 884 Wainwright St, Benicia, CA 94510 and is currently estimated at $1,080,372, approximately $449 per square foot. 884 Wainwright St is a home located in Solano County with nearby schools including Mary Farmar Elementary School, Benicia Middle School, and Benicia High School.
Ownership History
Date
Name
Owned For
Owner Type
Purchase Details
Closed on
Dec 8, 2019
Sold by
Clarke Stephen and Canada Mary Yvonne
Bought by
Clarke Stephen and Canada Mary Yvonne
Current Estimated Value
Purchase Details
Closed on
Jun 9, 2017
Sold by
Clarke Stephen A
Bought by
Clarke Stephen A and Canada Mary Yvonne
Home Financials for this Owner
Home Financials are based on the most recent Mortgage that was taken out on this home.
Original Mortgage
$249,900
Outstanding Balance
$207,922
Interest Rate
4.03%
Mortgage Type
Credit Line Revolving
Estimated Equity
$872,450
Purchase Details
Closed on
Jun 8, 2017
Sold by
Canada Mary Yvonne
Bought by
Clarke Stephen A
Home Financials for this Owner
Home Financials are based on the most recent Mortgage that was taken out on this home.
Original Mortgage
$249,900
Outstanding Balance
$207,922
Interest Rate
4.03%
Mortgage Type
Credit Line Revolving
Estimated Equity
$872,450
Purchase Details
Closed on
Jun 2, 2017
Sold by
Haan James W
Bought by
Clarke Stephen A
Home Financials for this Owner
Home Financials are based on the most recent Mortgage that was taken out on this home.
Original Mortgage
$249,900
Outstanding Balance
$207,922
Interest Rate
4.03%
Mortgage Type
Credit Line Revolving
Estimated Equity
$872,450
Purchase Details
Closed on
Jan 6, 2017
Sold by
Haan James W
Bought by
Haan James W
Home Financials for this Owner
Home Financials are based on the most recent Mortgage that was taken out on this home.
Original Mortgage
$646,141
Interest Rate
4.08%
Mortgage Type
VA
Purchase Details
Closed on
Sep 29, 2015
Sold by
Haan James W and Haan James W
Bought by
Haan James W
Purchase Details
Closed on
Aug 12, 2015
Sold by
Kittredge Janice and Lowe Diana
Bought by
Haan James W
Purchase Details
Closed on
Apr 21, 2004
Sold by
Moore Maureen A
Bought by
Moore Maureen A
Purchase Details
Closed on
Oct 2, 2001
Sold by
Moore Maureen A
Bought by
Moore Maureen A
Purchase Details
Closed on
Apr 2, 2000
Sold by
Moore Maureen A
Bought by
Moore Maureen A
Purchase Details
Closed on
Jul 13, 1995
Sold by
Allen Roger S and Niland Martha
Bought by
Moore Maureen A
Home Financials for this Owner
Home Financials are based on the most recent Mortgage that was taken out on this home.
Original Mortgage
$194,250
Interest Rate
7.59%
Purchase Details
Closed on
Jun 30, 1995
Sold by
Stagno Anthony J
Bought by
Moore Maureen A
Home Financials for this Owner
Home Financials are based on the most recent Mortgage that was taken out on this home.
Original Mortgage
$194,250
Interest Rate
7.59%
Create a Home Valuation Report for This Property
The Home Valuation Report is an in-depth analysis detailing your home's value as well as a comparison with similar homes in the area
Home Values in the Area
Average Home Value in this Area
Purchase History
| Date | Buyer | Sale Price | Title Company |
|---|---|---|---|
| Clarke Stephen | -- | None Available | |
| Clarke Stephen A | -- | None Available | |
| Clarke Stephen A | -- | Old Republic Title Company | |
| Clarke Stephen A | $850,000 | Old Republic Title Company | |
| Haan James W | -- | Consumers Title Company | |
| Haan James W | -- | Consumers Title Company | |
| Haan James W | -- | None Available | |
| Haan James W | -- | None Available | |
| Moore Maureen A | -- | -- | |
| Moore Maureen A | -- | -- | |
| Moore Maureen A | -- | -- | |
| Moore Maureen A | $259,000 | Fidelity National Title Ins | |
| Moore Maureen A | -- | Fidelity National Title Ins |
Source: Public Records
Mortgage History
| Date | Status | Borrower | Loan Amount |
|---|---|---|---|
| Open | Clarke Stephen A | $249,900 | |
| Open | Clarke Stephen A | $424,100 | |
| Previous Owner | Haan James W | $646,141 | |
| Previous Owner | Moore Maureen A | $194,250 |
Source: Public Records
Tax History
| Year | Tax Paid | Tax Assessment Tax Assessment Total Assessment is a certain percentage of the fair market value that is determined by local assessors to be the total taxable value of land and additions on the property. | Land | Improvement |
|---|---|---|---|---|
| 2025 | $11,474 | $986,493 | $348,172 | $638,321 |
| 2024 | $11,474 | $967,151 | $341,346 | $625,805 |
| 2023 | $11,196 | $948,188 | $334,653 | $613,535 |
| 2022 | $10,986 | $929,597 | $328,093 | $601,504 |
| 2021 | $10,761 | $911,370 | $321,660 | $589,710 |
| 2020 | $10,617 | $902,026 | $318,362 | $583,664 |
| 2019 | $10,431 | $884,340 | $312,120 | $572,220 |
| 2018 | $10,245 | $867,000 | $306,000 | $561,000 |
| 2017 | $5,306 | $450,103 | $71,573 | $378,530 |
| 2016 | $5,350 | $441,278 | $70,170 | $371,108 |
| 2015 | $5,214 | $434,650 | $69,116 | $365,534 |
| 2014 | $5,068 | $426,137 | $67,763 | $358,374 |
Source: Public Records
Map
Nearby Homes
- 926 W K St
- 836 W K St
- 1155 Daniel Hills Ct
- 1190 Church St
- 900 Southampton Rd Unit 110
- 900 Southampton Rd Unit 2
- 900 Southampton Rd Unit 140
- 900 Southampton Rd Unit 24
- 900 Southampton Rd Unit 51
- 900 Southampton Rd
- 520 Raymond Dr
- 1491 Karen Dr
- 565 Lori Dr Unit 80
- 565 Lori Dr Unit 58
- 1365 W L St
- 117 Sunset Cir Unit 36
- 100 Sunset Cir Unit 68
- 1740 Stuart Ct
- 138 Warwick Dr Unit 77
- 2000 Clearview Cir
Your Personal Tour Guide
Ask me questions while you tour the home.