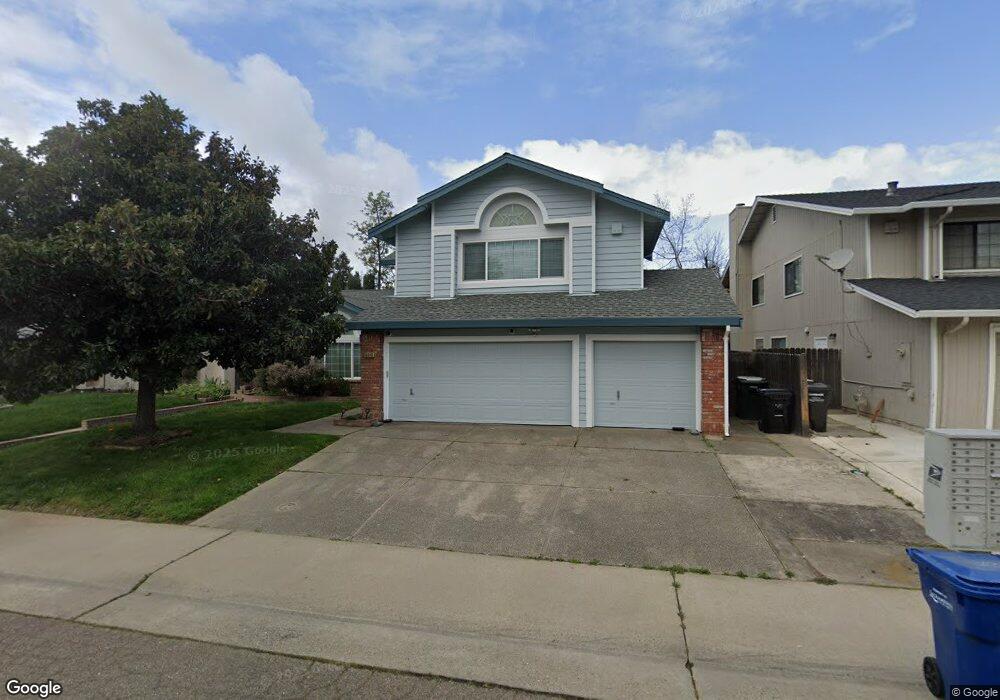
8840 Liscarney Way Sacramento, CA 95828
Estimated Value: $622,365 - $652,000
5
Beds
3
Baths
2,737
Sq Ft
$233/Sq Ft
Est. Value
About This Home
This home is located at 8840 Liscarney Way, Sacramento, CA 95828 and is currently estimated at $637,091, approximately $232 per square foot. 8840 Liscarney Way is a home located in Sacramento County with nearby schools including Mary Tsukamoto Elementary School, T. R. Smedberg Middle School, and Sheldon High School.
Ownership History
Date
Name
Owned For
Owner Type
Purchase Details
Closed on
May 19, 2010
Sold by
Morris Roger D and Morris Debra A
Bought by
Morris Roger D and Morris Debra A
Current Estimated Value
Purchase Details
Closed on
Feb 22, 2008
Sold by
Johinson Mae L
Bought by
Morris Roger D and Morris Debra A
Home Financials for this Owner
Home Financials are based on the most recent Mortgage that was taken out on this home.
Original Mortgage
$238,700
Interest Rate
6%
Mortgage Type
Purchase Money Mortgage
Purchase Details
Closed on
Oct 24, 2003
Sold by
Johnson Mae L
Bought by
Johnson Mae L
Home Financials for this Owner
Home Financials are based on the most recent Mortgage that was taken out on this home.
Original Mortgage
$203,000
Interest Rate
5.94%
Mortgage Type
Purchase Money Mortgage
Purchase Details
Closed on
Dec 28, 1998
Sold by
Johnson James E
Bought by
Johnson Mae L
Create a Home Valuation Report for This Property
The Home Valuation Report is an in-depth analysis detailing your home's value as well as a comparison with similar homes in the area
Home Values in the Area
Average Home Value in this Area
Purchase History
| Date | Buyer | Sale Price | Title Company |
|---|---|---|---|
| Morris Roger D | -- | None Available | |
| Morris Roger D | $310,000 | Cornerstone Title Company | |
| Johnson Mae L | -- | First American Title Co | |
| Johnson Mae L | -- | -- |
Source: Public Records
Mortgage History
| Date | Status | Borrower | Loan Amount |
|---|---|---|---|
| Previous Owner | Morris Roger D | $238,700 | |
| Previous Owner | Johnson Mae L | $203,000 |
Source: Public Records
Tax History Compared to Growth
Tax History
| Year | Tax Paid | Tax Assessment Tax Assessment Total Assessment is a certain percentage of the fair market value that is determined by local assessors to be the total taxable value of land and additions on the property. | Land | Improvement |
|---|---|---|---|---|
| 2025 | $4,412 | $407,175 | $131,343 | $275,832 |
| 2024 | $4,412 | $399,192 | $128,768 | $270,424 |
| 2023 | $4,301 | $391,366 | $126,244 | $265,122 |
| 2022 | $4,228 | $383,693 | $123,769 | $259,924 |
| 2021 | $4,181 | $376,171 | $121,343 | $254,828 |
| 2020 | $4,125 | $372,315 | $120,099 | $252,216 |
| 2019 | $4,050 | $365,016 | $117,745 | $247,271 |
| 2018 | $3,941 | $357,860 | $115,437 | $242,423 |
| 2017 | $3,873 | $350,844 | $113,174 | $237,670 |
| 2016 | $3,679 | $343,965 | $110,955 | $233,010 |
| 2015 | $3,610 | $338,799 | $109,289 | $229,510 |
| 2014 | $3,550 | $332,164 | $107,149 | $225,015 |
Source: Public Records
Map
Nearby Homes
- 8831 Liscarney Way
- 8836 Inisheer Way
- 8772 Crusheen Way
- 8902 Cobble Crest Dr
- 8906 Cobble Crest Dr
- 8269 Red Rock Dr
- 8643 Rothenburg Ct
- 8809 Coral Berry Way
- 8805 Coral Berry Way
- 8247 Derbyshire Cir
- 8170 Derbyshire Cir
- Plan 1 at Heartstone
- Plan 2 at Heartstone
- Plan 3 at Heartstone
- 8352 Tannic Dr
- 8990 Chantal Way
- 9065 Robbins Rd
- 8916 Hollowstone Way
- 9028 Brittany Park Dr
- 8788 Apricot Woods Way
- 8836 Liscarney Way
- 8844 Liscarney Way
- 8799 Frosses Ct
- 8848 Liscarney Way
- 8832 Liscarney Way
- 8843 Liscarney Way
- 8839 Liscarney Way
- 8847 Liscarney Way
- 8835 Liscarney Way
- 8794 Frosses Ct
- 8795 Frosses Ct
- 8851 Liscarney Way
- 8814 Liscarney Way
- 8825 Clonmel Ct
- 8821 Clonmel Ct
- 8808 Liscarney Way
- 8804 Liscarney Way
- 8817 Clonmel Ct
- 8790 Frosses Ct
- 8855 Liscarney Way